
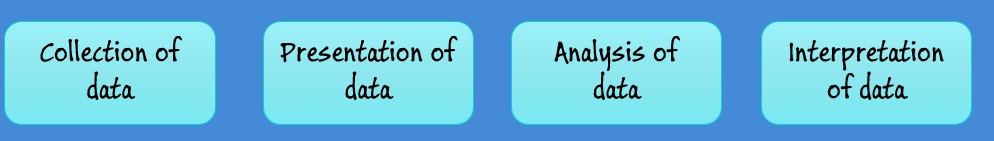
Statistics plays important role in Data Science. It deals with raw data. Could be sample data or population data. We collect the raw data,summarize, analyze them and report the findings. According to Croxton and Cowden, we deal with two types of statistics 1) Descriptive and 2) Inferential Statistics


Variables Used in Statistics:
Variables could be either Quantitative or Qualitative
Qualitative Variables: Referred to as attributes. Example: People may have hairs with color, Brown, black, white etc. Type of car, Color of pen, gender etc Qualitative variables may be classified under two or more categories.
Quantitative Variables: Under these we deal with two types of variables
- Discrete Variables:a. Discrete quantitative variables can take only certain values along an interval, with the possible values having gaps between them. Ex: No. of employees on the payroll in a school. No. of defectives in a production sample. b. The individual observations could be counted and often have integer values. c. Fractional values are also possible.
- Continuous Variables:1.It can take a value at any point along an interval2.Example: The price of a foreign currency USD may fall in between 46.01 to 48.09.3.Fractional values are taken.Example: Marks obtained, weight of students,
There are four levels of measurements involved in Statistics
Nominal data: example: Married, Divorced, widowed
Ordinal data: example:Excellent, good, average, poor
Interval data: Enables you to quantify, compare, marks from 0 to 100
Ratio data: similar to interval. Ex. X is two times more than Y. measures of time and space.
Nominal has no order. Ordinal data can be ordered. Both belong to categorical data.
Interval and Ratio are related to quantitative data.
Data Science is mainly concerned with Measure of Central Tendency and Measure of dispersion. At the higher end we particularly deal with
Measure of Central Tendency
a) Mean/average,
b) Median
c) Mode
Measure of Dispersion
d) Standard Deviation
e) Variance
Arithematic Mean:
- This is nothing but average of the data collected.
- A point which represents the entire data collected
- This is calculated as shown below:

Where X1, X2… are individual observations; xbar is the mean of the data, n is the number of observations or data points. Under direct method

Income of 10 persons has been given. Mean income of that team is 23oo/10 =230
AM under Frequency Distribution:
When the same values in a set of values repeat a number of times they have to be presented in the form of a frequency table.The frequency is the number of times the value is repeated.Here the individual observations (say X1 occurs f1 times,X2 occurs f2 times like that).
Formual for Direct Method:


Median:
- Median is the middle of most of the data.
- It divides the data into two equal parts

Find out the median of the following marks obtained:
Marks 56,73,29,80,44,50,65,63,72,35,42,39,45
In order to find the median you have to sort the given data
The number of given data is 13 that is ODD.
The middle of the data will be

Sort the data items. Sorted data is 29,35,39,42,44,45,50,56,63,65,72,73,80
The answer is 50 (ie.7 th item)
Median Under Frequency Distribution:

where
l = lower limit of Median class
c = length of the median class
f = frequency of the Median class
m = cumulative frequency less than the Median class
N = total frequency

Quartiles:
Quartiles divide the data into four equal parts. So we get three quartiles.


Measure of Dispersion:
1.Measure of location enables you to locate the position of the data.
2.Measure of dispersion enables you to find out the way how the data is dispersed /spread from the measure of location( may be mean, median or mode)
ABSOLUTE MEASURE OF DISPERSION:
We have four types of Absolute Measure of Dispersion. They are
a) Range
The range is the difference between the maximum and the minimum value of the given data
b) Quartile Deviation

The difference of upper and lower quartile (Q3-Q1) is called Inter-Quartile Range(IQR) and Quartile Deviation is called semi inter-quartile range.
c) Mean Deviation: Find out mean deviation from the mean of the data

d) Standard Deviation
Important measure in Statistics

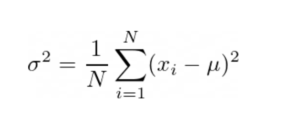
Variance:
The variance is the average of the squares of deviation from the mean.
- a) For Discrete Variables:

b.For continuous Variables


Standard Deviation – Direct Method
The scores of 8 students in Mathematics are given below: Let it be total population in a tution centre. Find standard deviation of population


Variation of the Sample & Standard Deviation of the Sample:
Let us assume the abovesaid data belongs to a sample. Then let us find the variation of the sample and standard deviation of the sample as shown below
| data x | x^2 | (x-xbar)^2 | ||
| 86 | 7396 | 14.0625 | ||
| 75 | 5625 | 52.5625 | ||
| 80 | 6400 | 5.0625 | ||
| 85 | 7225 | 7.5625 | ||
| 90 | 8100 | 60.0625 | ||
| 82 | 6724 | 0.0625 | ||
| 79 | 6241 | 10.5625 | ||
| 81 | 6561 | 1.5625 | ||
| Total | 658 | 54272 | 151.5 | |
| mean | 82.25 | |||
| Using formula | population | sample | ||
| VAR | 18.9375 | 21.642857 | ||
| STD | 4.3517238 | 4.6521884 | ||
| Using Excel Function | Var.P/STDEV.P | VAR.S/STDEV.S | ||
| VAR | 18.9375 | 21.642857 | ||
| STD | 4.3517238 | 4.6521884 | ||
Formulae used:
For population variance and population Standard Deviation:
For Sample population and Sample Standard deviation:

