1.VARIANCE THRESHOLD:
This technique removes all features whose variance does meet the specified threshold condition. Features with very low Variance or constant variance do not carry much information. Under pre-processing process this technique enables you to remove features which are not giving any valuable information for model analysis. In a dataset where one feature is mostly constant (e.g., almost all values are 1), a variance threshold can remove this feature before further analysis. Workflow:
- Calculate variance of each feature
- Compare the variance of each feature to a specified threshold
- Remove the features with variance which fall below the threshold value specified
Python:
Let us use the data available in Kaggle Breast Cancer Wisconsin (Diagnostic) Data Set and reduce the features available. This dataset contains one target/dependent variable and 31 features(independent/explanatory variables)
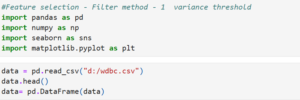
Load Libraries and read data
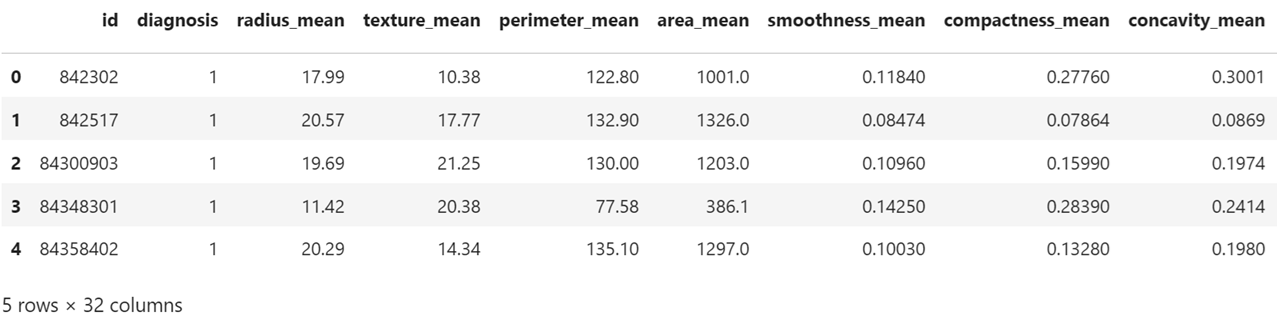
Find shape of the data
Shape of the data: Contains 569 records and each record contains 32 features

our aim is to select relevant features so as to avoid irrelevant features which do not contribute info
Split the data into training set and testing set

training set : 70% and test set is 30%.
convert the training data set related to exogenous/explanatory variables into numeric using numpy

Use variance threshold library with threshold = 0.5
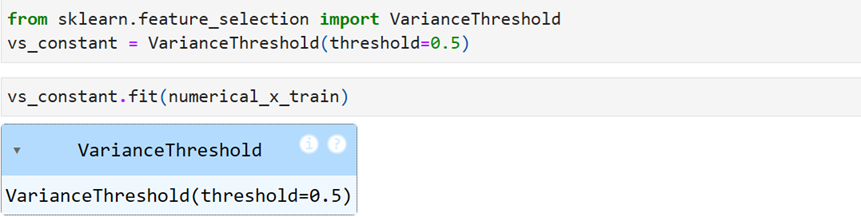
Based on the condition the features are reduced to 11. Supported features

Selected Features out oringinal features 31+ 1(dependent variable)

It means based variance on threshold conditions we can remove the irrelevant features (20) which do not contribute much information. Let us select the selected features and placed in dataframe df2
df2 = pd.DataFrame(data, columns=[‘id’, ‘radius_mean’, ‘texture_mean’, ‘perimeter_mean’,
‘area_mean’, ‘perimeter_se’, ‘area_se’, ‘radius_worst’, ‘texture_worst’,
‘perimeter_worst’, ‘area_worst’]) print(df2) x = df2
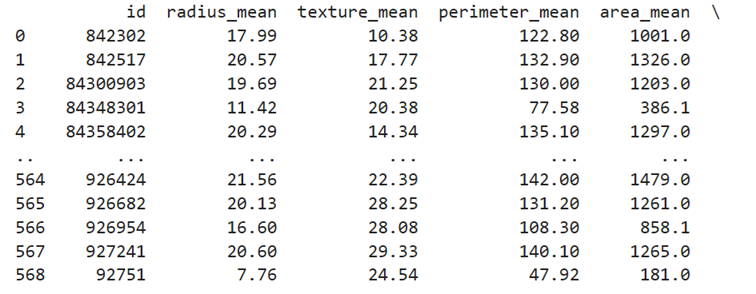
only 11 features are displayed
Find Accuracy of the Logistic Regression model:
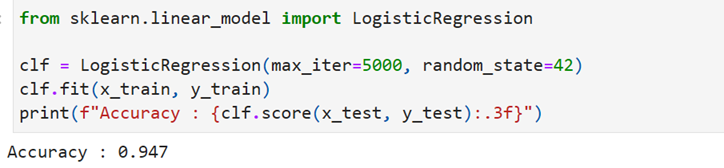
give max_iter more so you do not get error. The accuracy works out to 94.7%

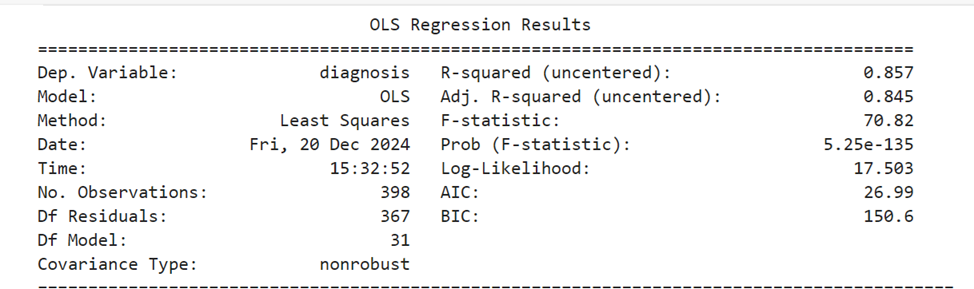
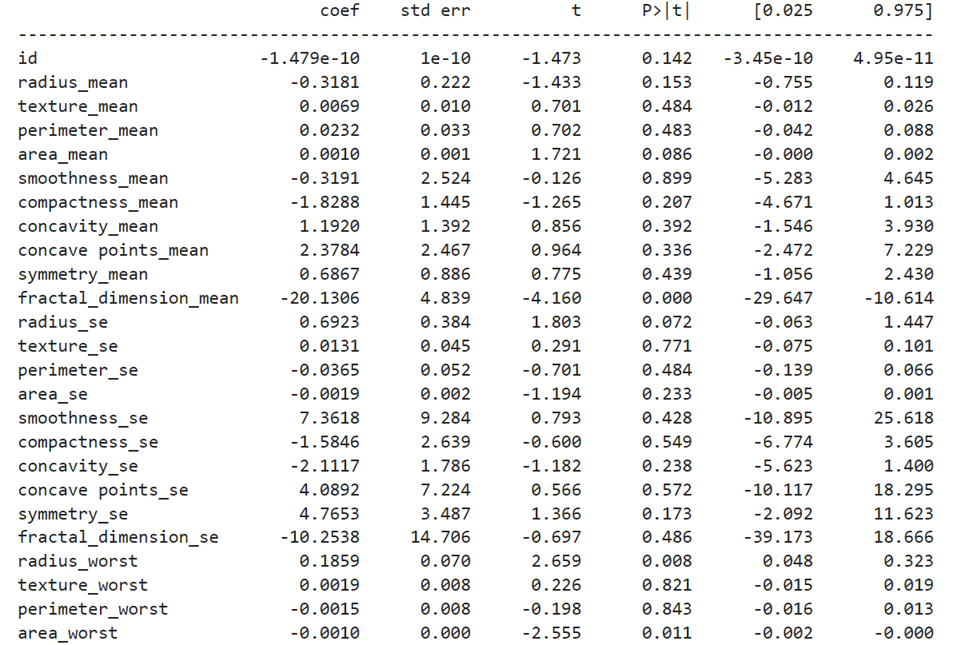
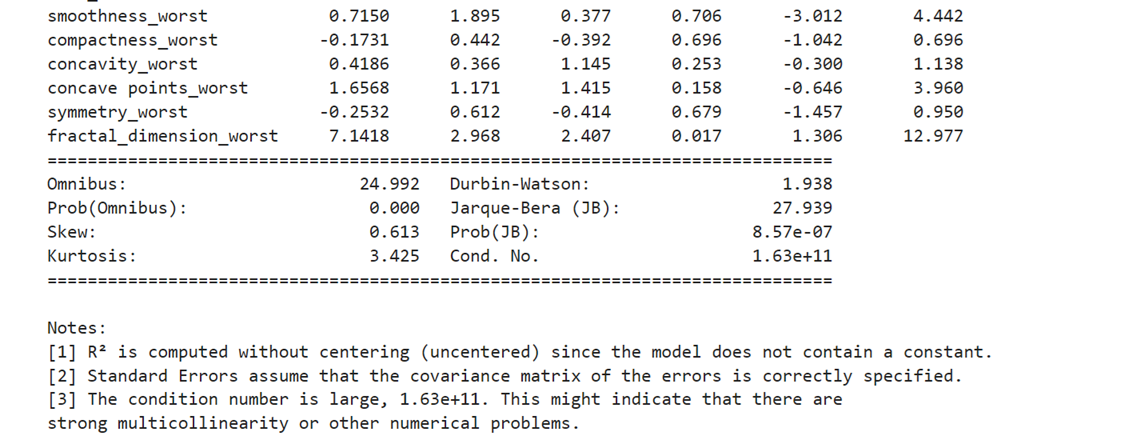
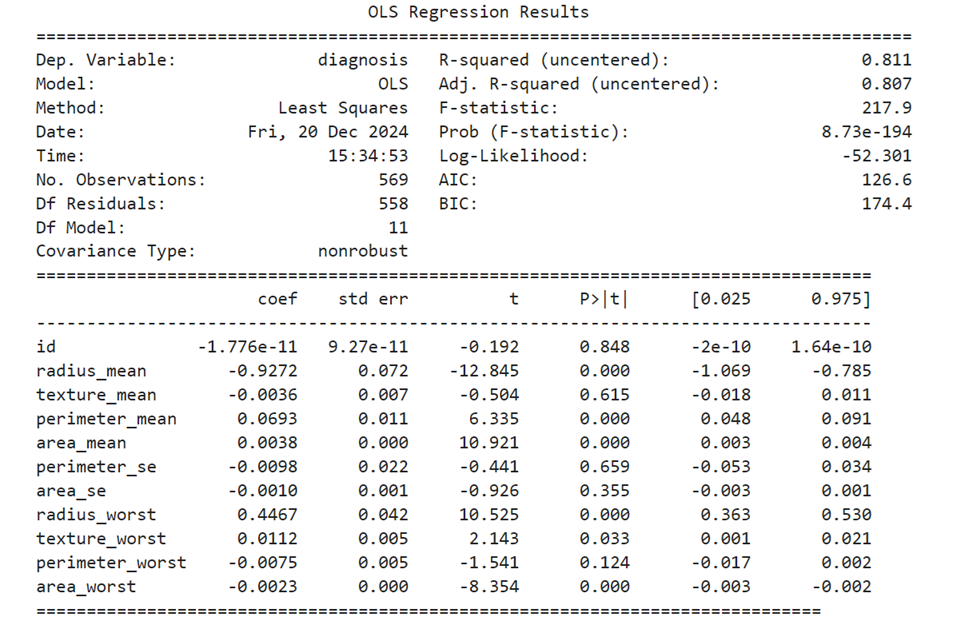
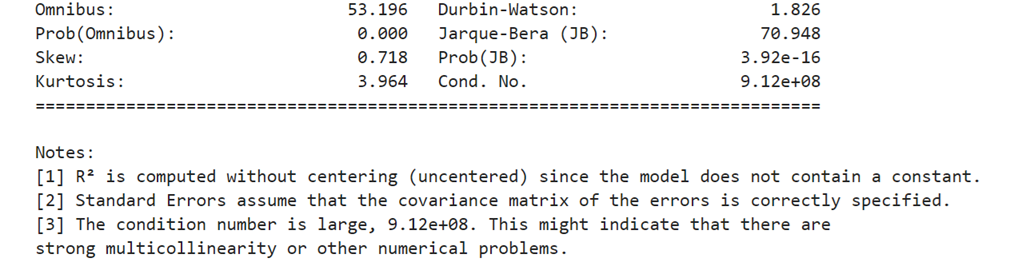
Ordinary Least Square method Model using statsmodels.api

OLS Summary
Logistic Regression Model
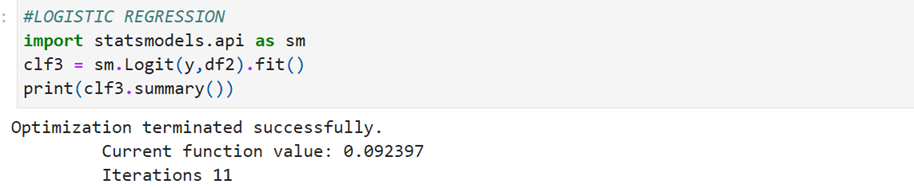
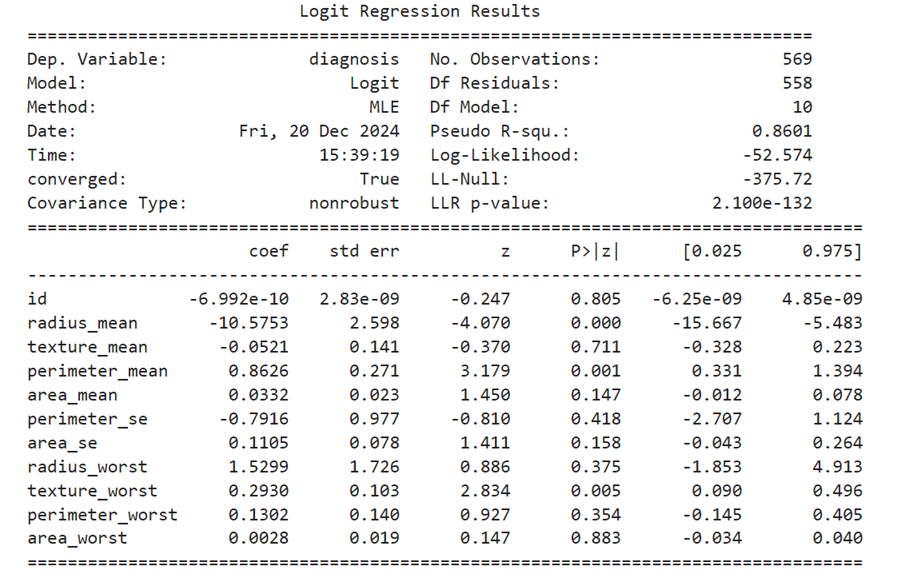
Since our y dependent variable is dichotomous ( yes or no | 1 or 0) we have to find out betas using Logistic Regression method

If you want to include all 31 features