This method evaluates the independence between categorical features and the target variable. It calculates the chi-square statistic to measure how expected counts compare to observed counts. Used for feature selection in classification problems with categorical features and target variables. Ex: In a survey dataset, the chi-square test can determine if there is a significant association between gender (feature) and preference for a product (target variable). Workflow: Step 1: Calculate the chi-square statistic and p-value for each feature.Step 2: Compare the p-values to a pre-defined significance level (e.g., 0.05).Step 3: Select features with p-values below the significance level
Load Libraries

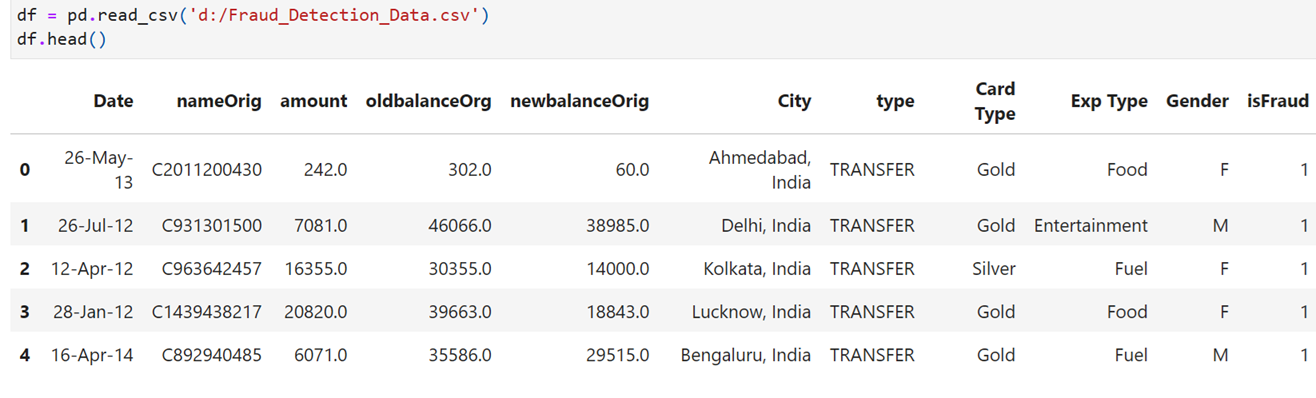
Read data
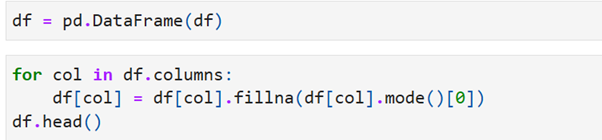
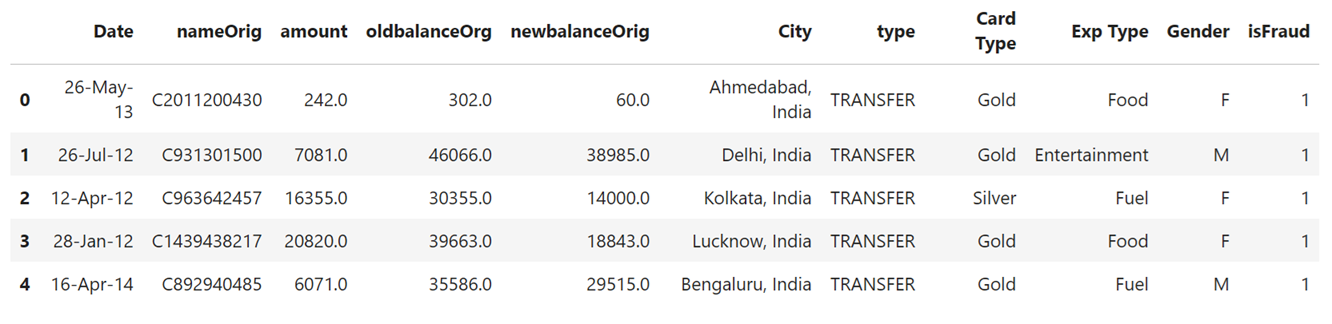
Fill missing values using mode function
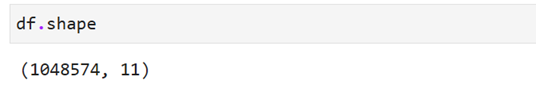
Data shape
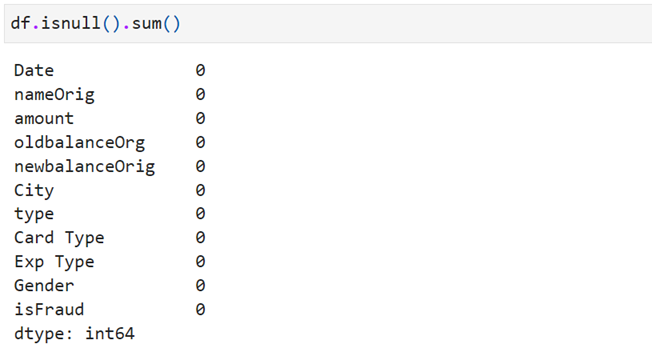
Find if any missing values found in data
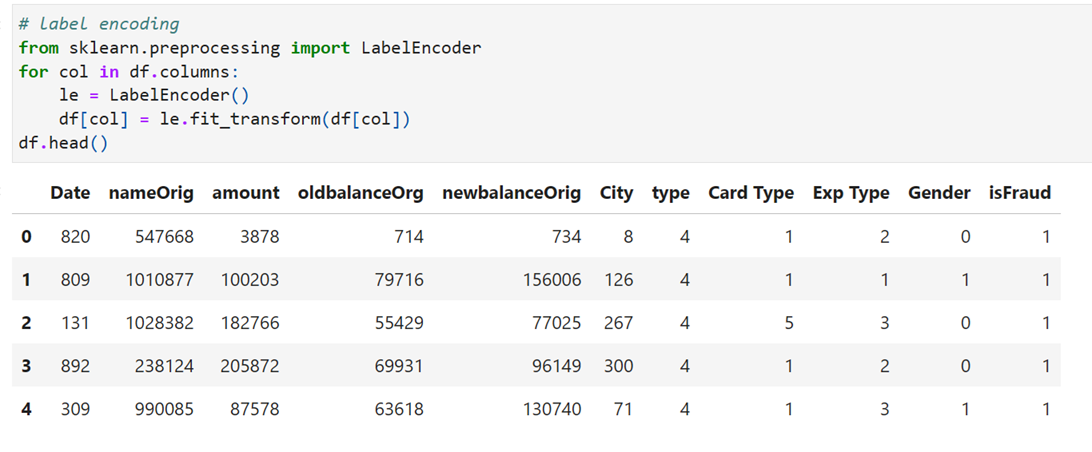
Convert Categorical Variables into numeric using Label Encoder function
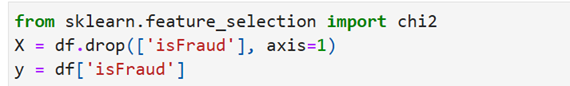
Separate features and target using X and y
Calculate Chi-square,pvalue individually for each feature with target variable
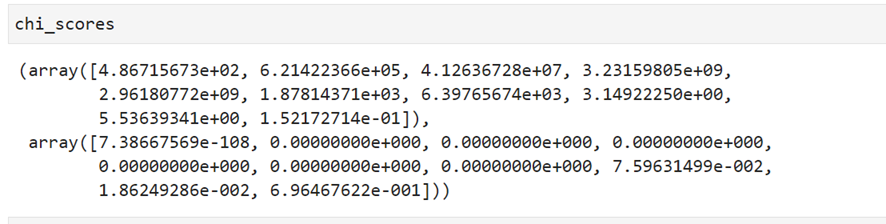
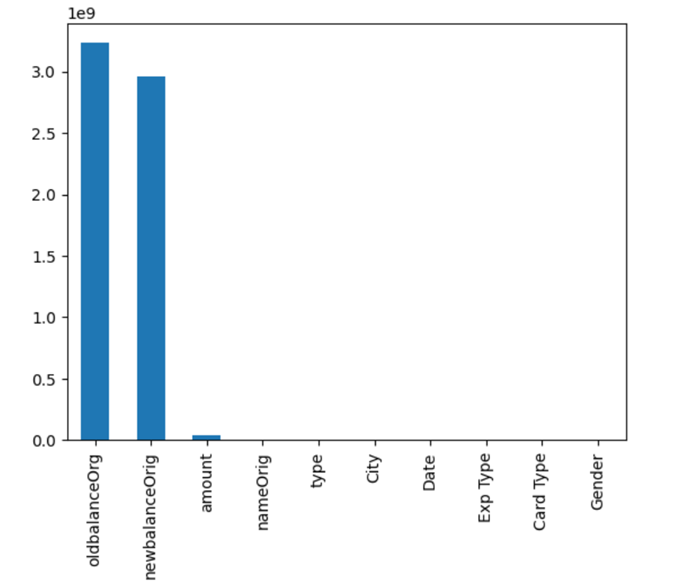
Display higher Chi2 feature

P-value > 0.05 irrelevant features with low importance
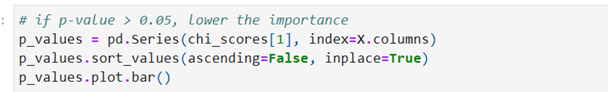
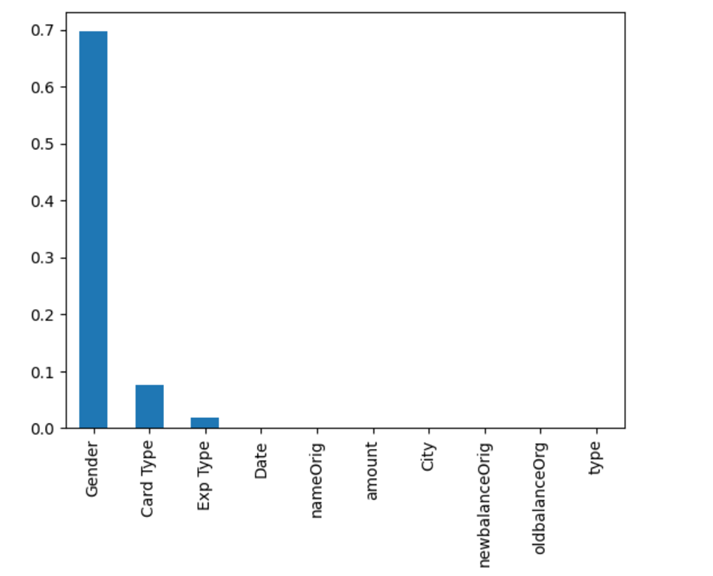
Gender, Card Type and exp type do not contribute any significance and so they may be removed
Find the selected features based on Chi-Square method
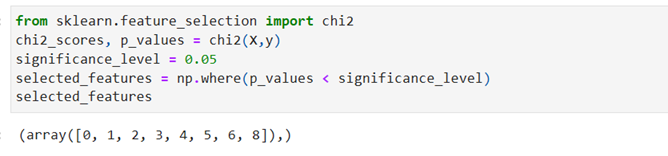
Display selected features
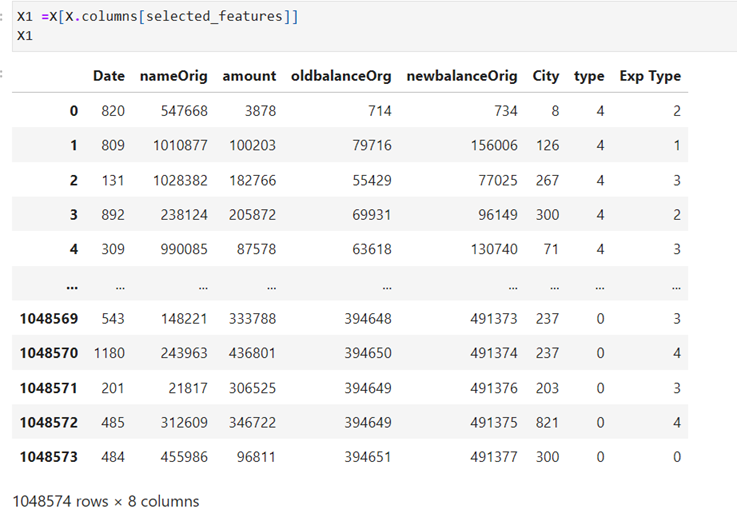
Out of 10 features 8 features have been selected based on chi-square method. Now the data is ready for further analysis.
Define y target variable once again

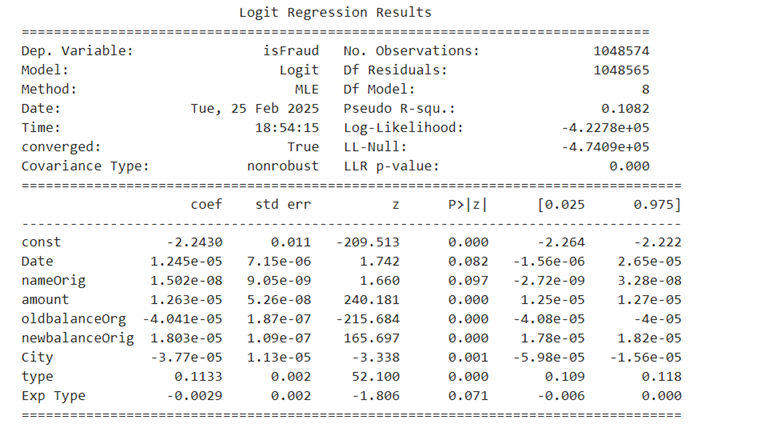
Use Logistic Regression Model to predict y using statsmodels
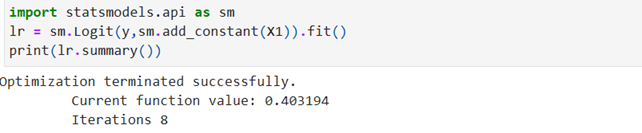
summary
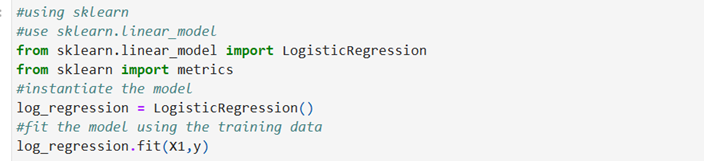
Prediction using sklearn

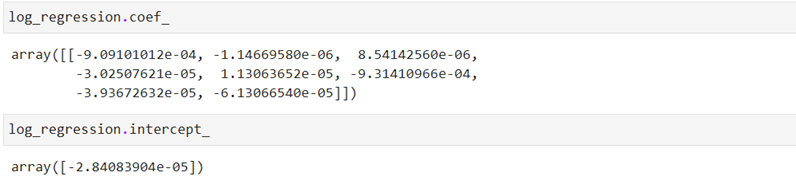
Beta Coeffecients and intercept
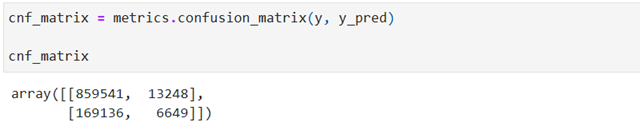
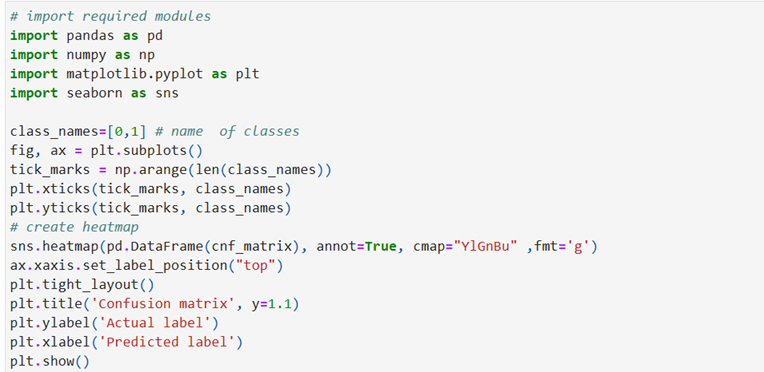
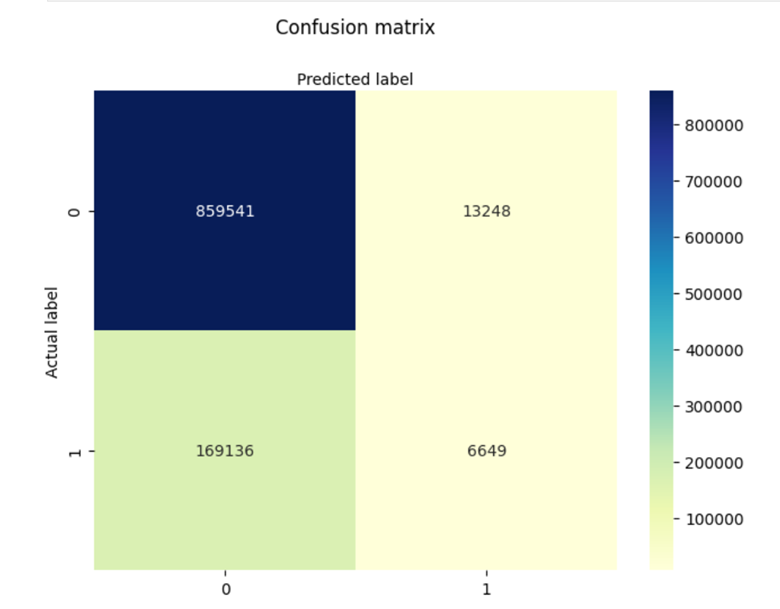
Confusion Matrix
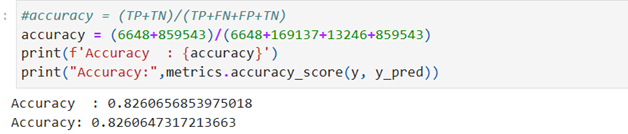
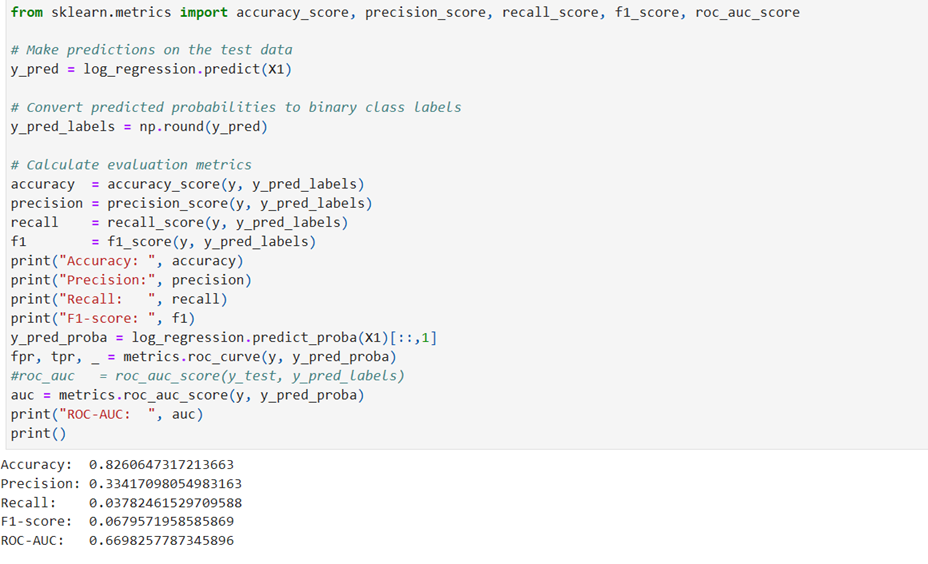
Calculation of Accuracy, Precision, Recall and f-statistics

Accuracy
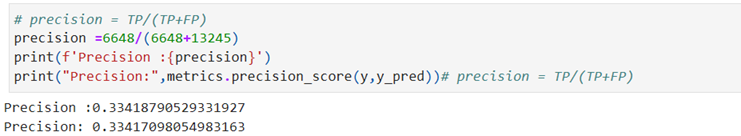
Precision:
Recall:

F1 score

Metrics
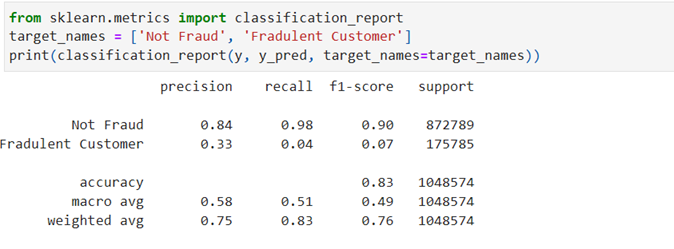
Classification Report
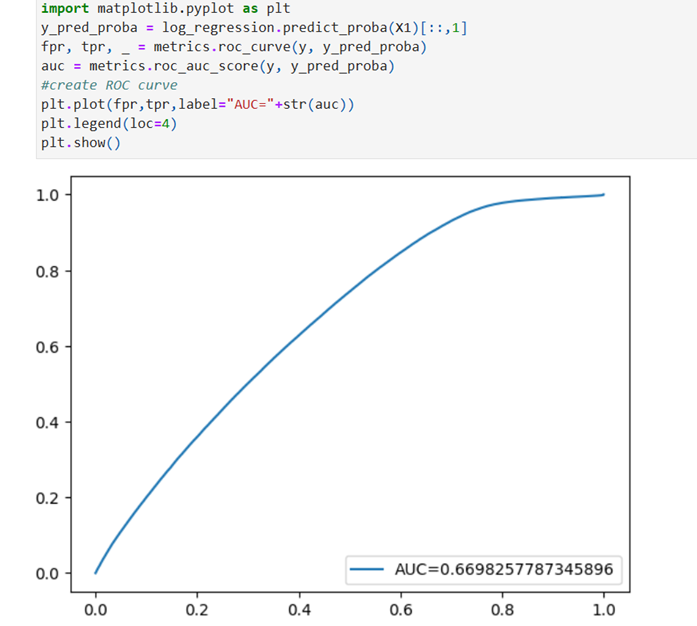
Receivers Operating Characteristics (ROC) and Area Under Curve (AUC)