Frequency encoding, also known as count encoding or value frequency encoding, is a technique in machine learning that replaces categorical values with their frequencies within the dataset. It transforms categorical data into numerical representations based on how often each category appears, offering a way to capture the importance of a category based on its distribution.
It captures the information about how frequently each category appears, allowing the model to learn the relationship between the category and the target variable indirectly.
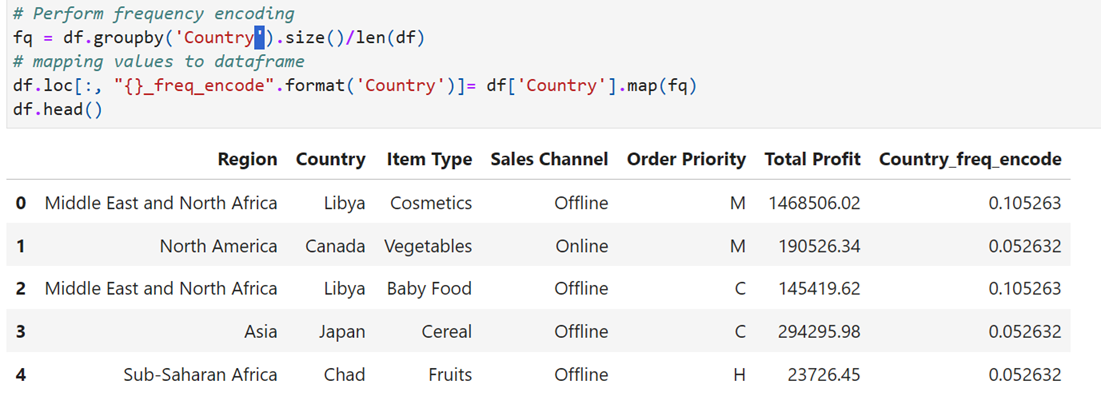
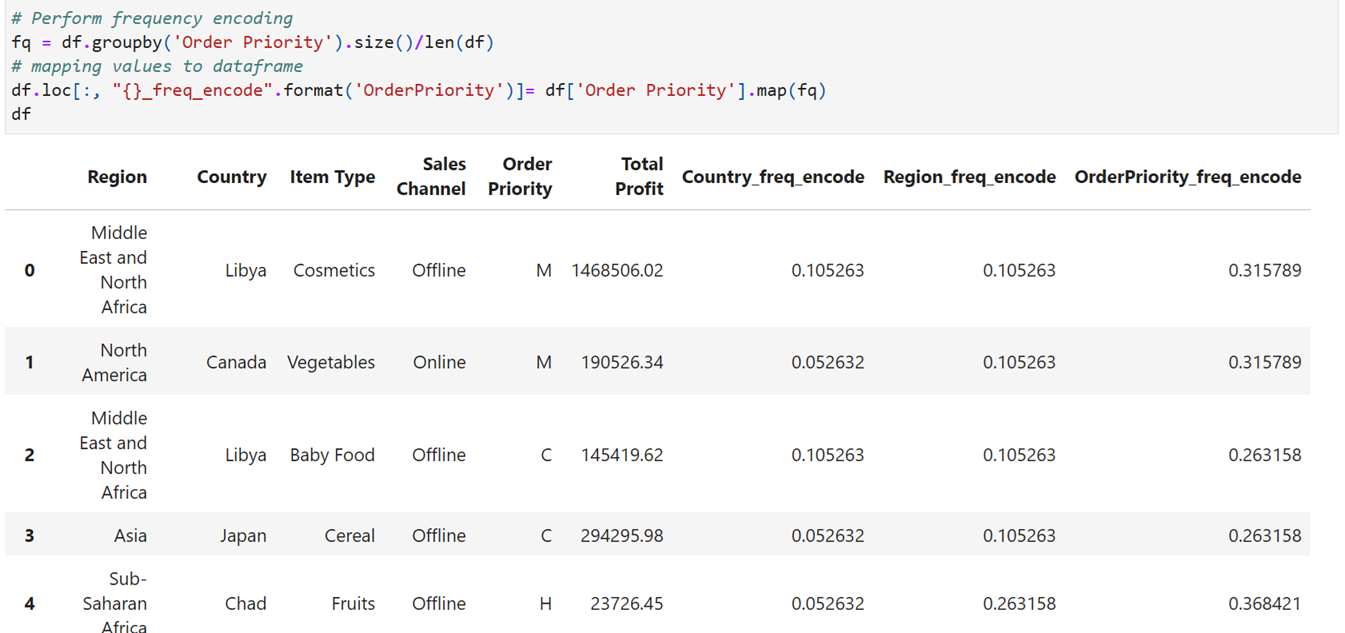
Frequency encoding replaces each unique category in a feature with the number of times it occurs in the entire dataset. Example :
For example, if the categories “A”, “B”, and “C” appear 50, 20, and 30 times respectively, they would be encoded as 50, 20, and 30, respectively.
-
- Reduces dimensionality: It can be particularly useful when dealing with high-cardinality categorical features, as it condenses multiple categories into a single numeric column.
- Preserves category importance: It captures the relative importance of each category based on its frequency, which can be useful if the frequency is a predictor of the target variable.
- Efficient: It is generally less computationally expensive than one-hot encoding, especially for large datasets.
Frequency encoding is often used when you believe that the frequency or count of a category holds some predictive value for the target variable, or when dealing with high-cardinality features to avoid the curse of dimensionality.
- Imbalanced categories: If some categories appear much more frequently than others, the encoded values might be dominated by the frequent categories, potentially leading to biases in the model.
- Loss of information: If multiple categories have similar frequencies, they may be assigned the same encoded value, potentially leading to a loss of information.
Use only when the frequency of a category provides useful information for predictive modeling
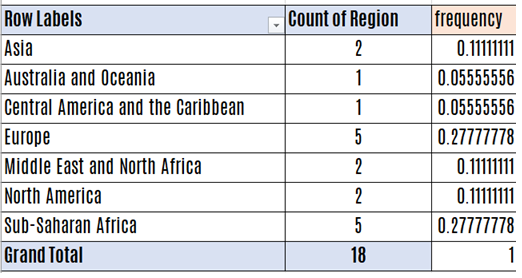
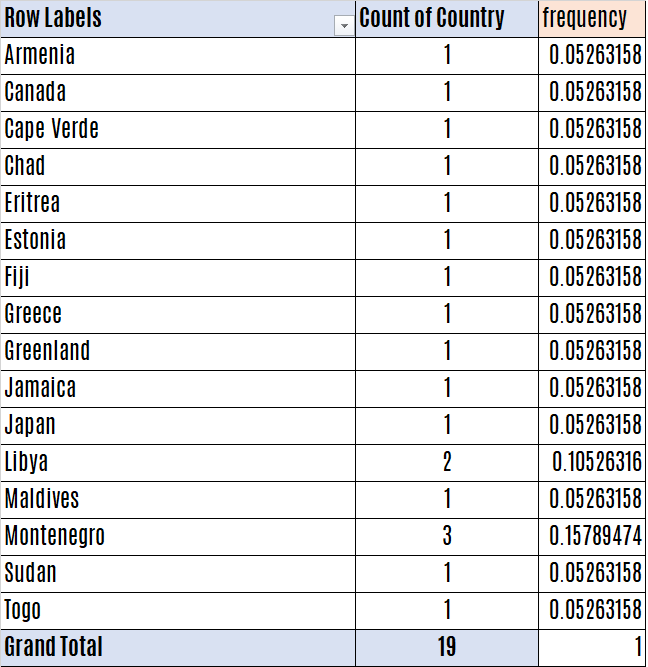
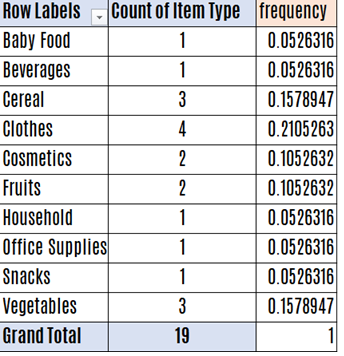
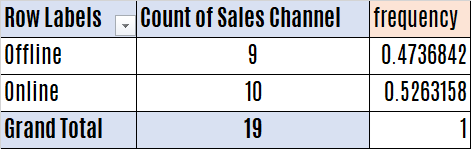
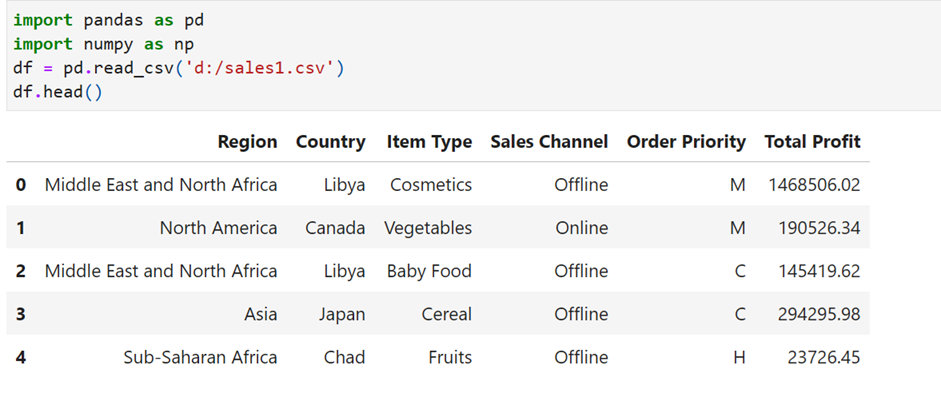
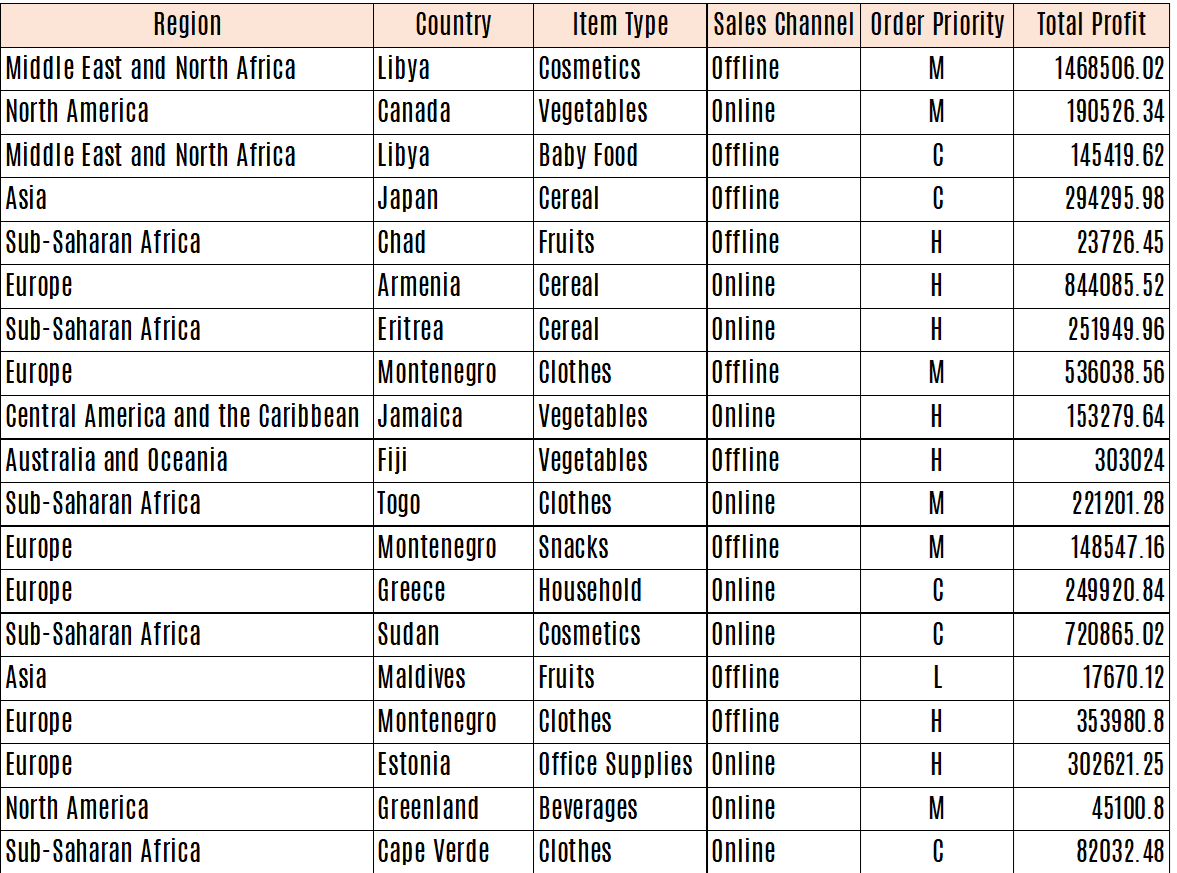
Let us have the following data containing categorical features like Region, Country, Item type, Sales Channel, Order Priority besides dependent variable Total profit. Our aim is to convert categorical variables in to numerical value based on frequency
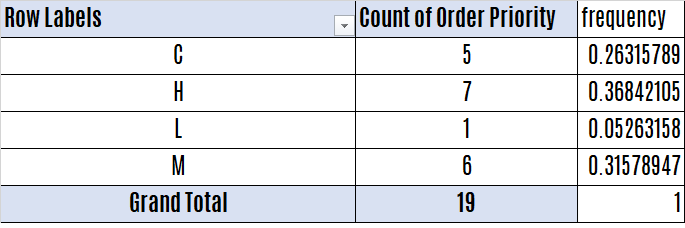
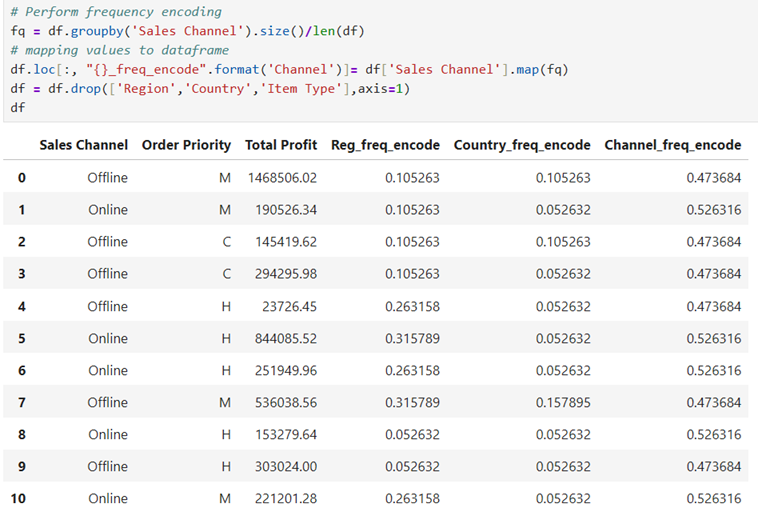
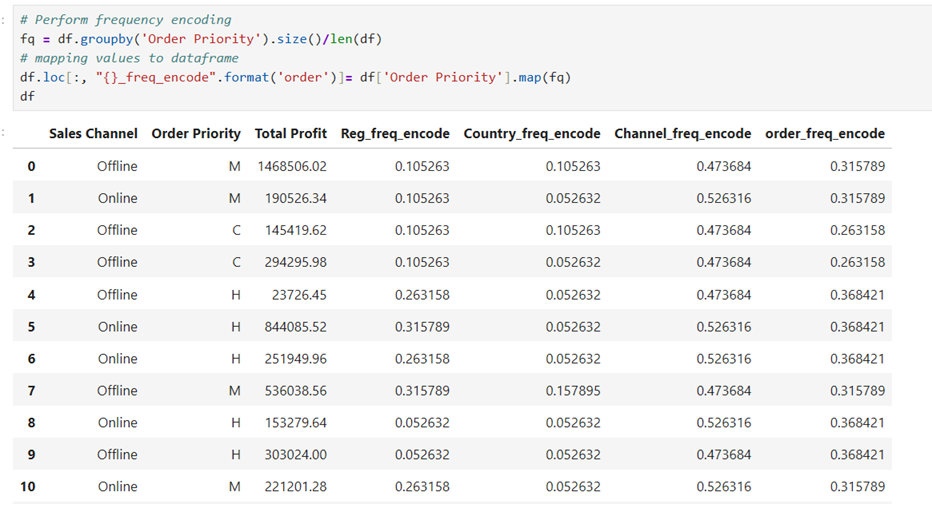
Let us find frequency for each features using pivot table