
Before going to the above mentioned topic let us learn the following terms.
- Normalization
- Standardization
- Regularization
- Generalization
Normalization:
- It is a pre-processing technique. Use to scale the given data to fit within a specific range 0 to 1
- This is applied when the given feature values are on different scales. In that case your prediction or performance of the model may be affected
- When you are using Common algorithms like k-nearest neighbors (KNN) and neural networks you must have scaled your data within a specific range (say O TO 1)
- In the above cases you are supposed to treat all the features equally in such a way that features with larger scales should not dominate other smaller scaled features in your decision making process.
Standardization:
- This is also another pre-processing technique.
- It scales the feature data with a mean equal to zero and standard deviation to 1
- Applicable to all normally distributed data. (data which produces a Bell-Shaped curve ) – Continuous Probability Distribution
- We assume that the given data is normally distributed
- Used in common algorithms like Linear Regression, Logistic Regression, Support Vector Machines(SVM)
- Improves model stability and convergence speed.

where
- Z is the standardized value (Z-score)
- x is the original value
- μ is the mean of all x values
- σ is the standard deviation of all x values
Regularization:
- This technique is used to prevent overfitting by adding a penalty to the loss function based on the complexity of the model.
- This technique is used when a model is too complex and learns noise from the training data instead of the underlying pattern.
- Used in common algorithms like linear regression (L1 and L2 regularization) and neural networks.
- improves the model’s generalization ability to handle unseen data
Generalization:
- The ability of a model to perform well on new, unseen data rather than just the training data.
- Here we ensure that the model isn’t just memorizing the training data at the time of model training and testing the dataset
- Important in all machine learning models.
- A model that generalizes well will make accurate predictions in real-world scenarios, making it more useful and reliable.

Let us deal with the following diabetic.csv data
Load libraries and read data

- Contains 8 features like preg,Glucose,BP,skinthick,Insulin, BMI, Pedigree, Age and one Dependent Feature Outcome.
- Outcome feature : If it is 0 then patient is not having any diabetic indication and if it 1 then it means that the person is having diabetic symptoms
Descriptive Statistics
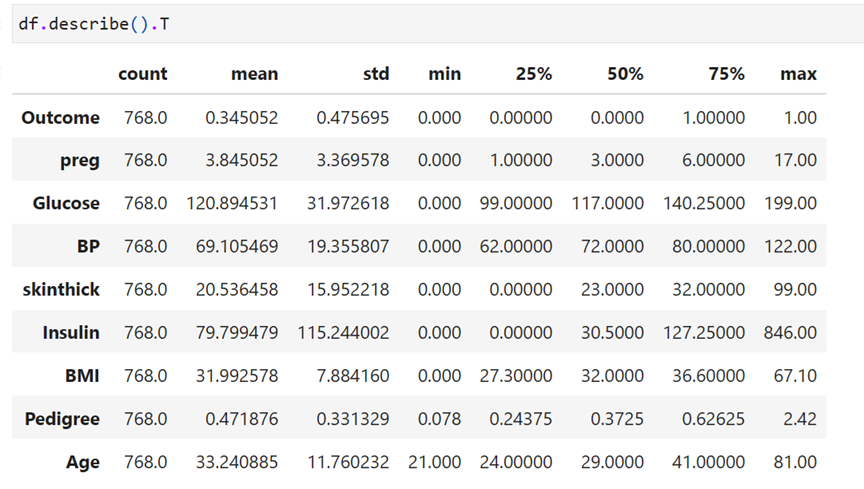
Contains 768 records
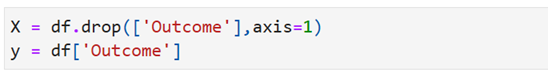
Separate features and target
Correlation heatmap

Convert data frame into array

Before Normalization – Logistic Regression using statsmodels.api – Original data is used

Before Normalization: Logistic Regression Using sklearn lib – original data

Fit and find Coefficients of betas and intercept

Confusion Matrix

Classification Report

Confusion Matrix HeatMap


Find Accuracy & Precision

Find recall and F1-score

Metrics in a single program

Calculate ROC-AUC


Normalize the Original Data Using L1 Normalization Technique

Separate feature and the target
Normalize the data
 is
is
After Normalization: Logistic Regression using sklearn linear model lib

Calculate coefficients and intercept

Confusion Matrix After Normalization

Confusion Matrix Heatmap


Classification Report

Metrics in a single program – After Normalization

ROC-AUC

