Models:
We use different types of models for prediction. Which one will be the best for the given data. Let us examine with the same data what we used in py-DecisioTreeRegressor-2. Students Performance(Multiple Linear Regression) dataset. you can download this from Kaggle
Load Libraries and Read data
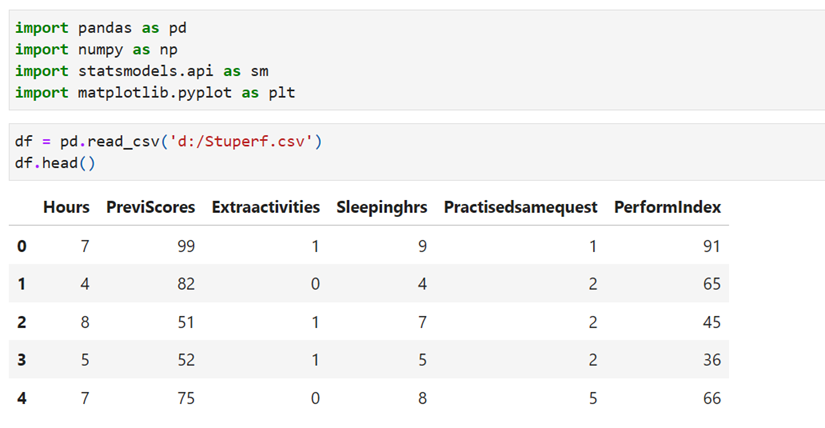
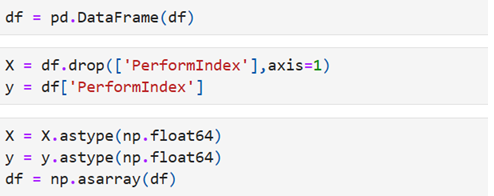
Separate the features and the target
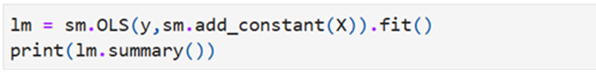
Ordinary Least Square Method – Find Linear Regression – using statsmodels
Summary
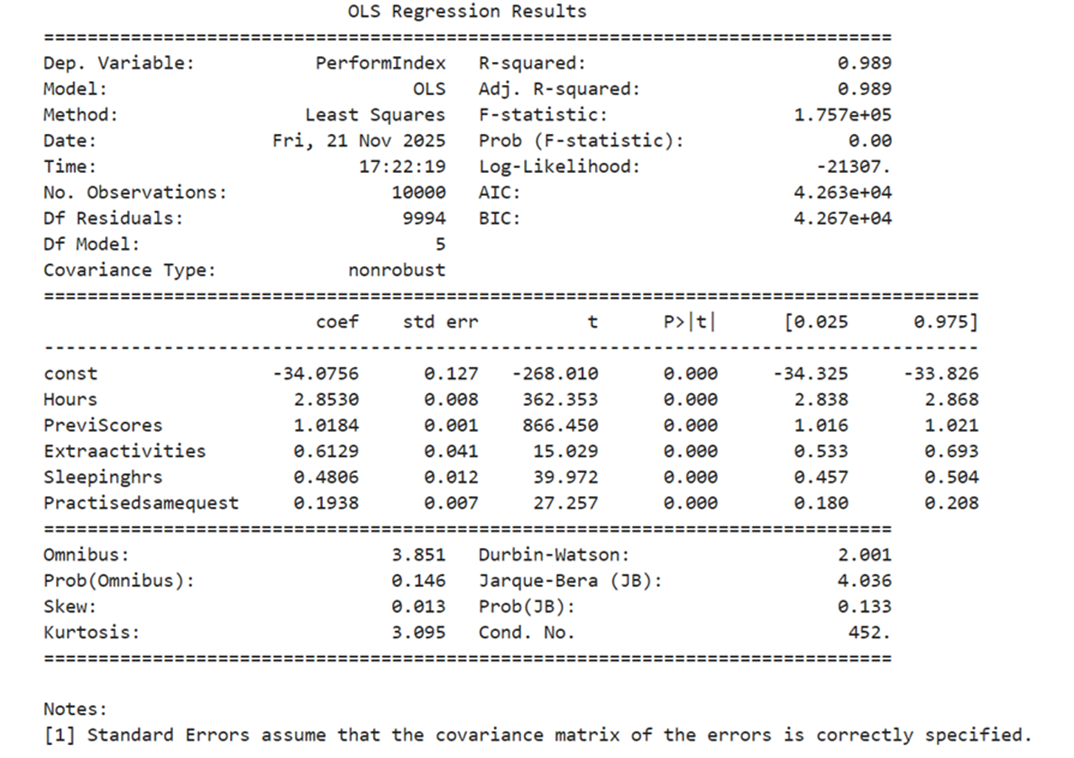
Important metrics are
R-Squared : 0.989 Interpretation: 98.9% of changes of target variable PerformIndex is explained by the features. It is a good sign. that the model produced under OLS is good
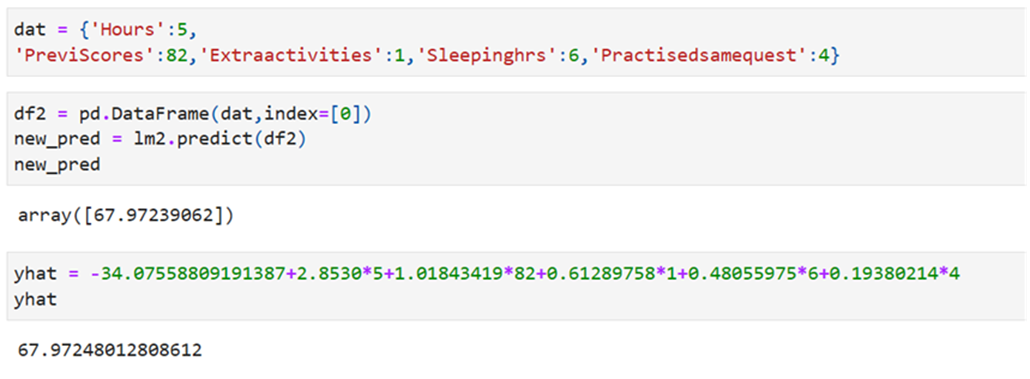
- PerformIndex Predicted = – 34.0756 +2.8530*Hours +1.0180*PreviScores+0.6129*Extraactivities+0.4806*Sleepinghrs+0.1938*Practisedsamequest
- Since the probability of all features fall less than 0.05 all features are statistically significant and all influence the change in PerformIndex. As per t test we reject the null hypothesis
- F-statistics is huge and its probability is less than 0.05 the model is good.
Method 2: Using SKlearn find R-Squared
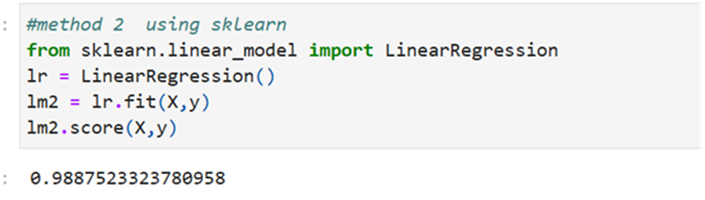
Here also R-Squared works out to 98.9% Explained ratio is nearer to 1.
Coefficients and Constants under SKlearn
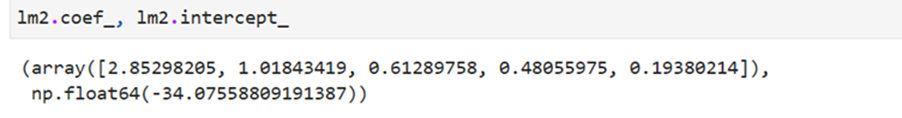
We get the same result under both methods. Under SKlearn we used to split the data into two sets 1) trainset and 2)testset for both X an y
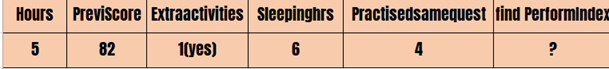
Using the formula predict the value of PerformIndex
Use the same SKlearn But split the data into twosets
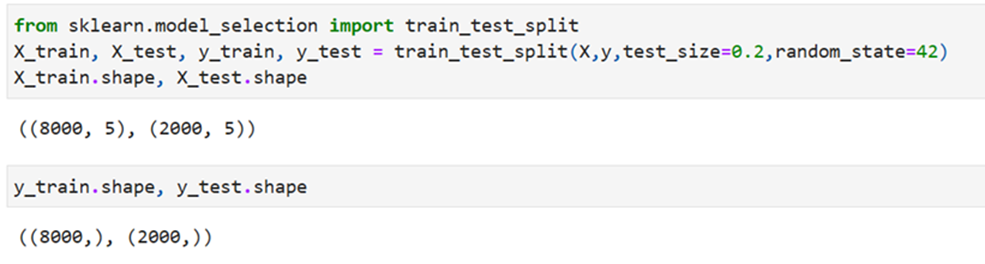
- Out of 10000 records 8000 records as X_train and y_train and 2000 records as X_test and y_test by specifying the argument test_size as 20%
- We have used train_test_split function imported from sklearn.model_selection
- 5 indicates the number of features used
Accuracy/R-Squared
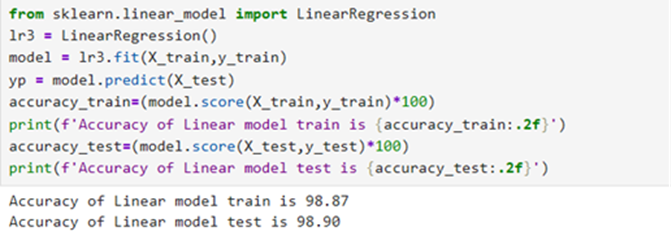
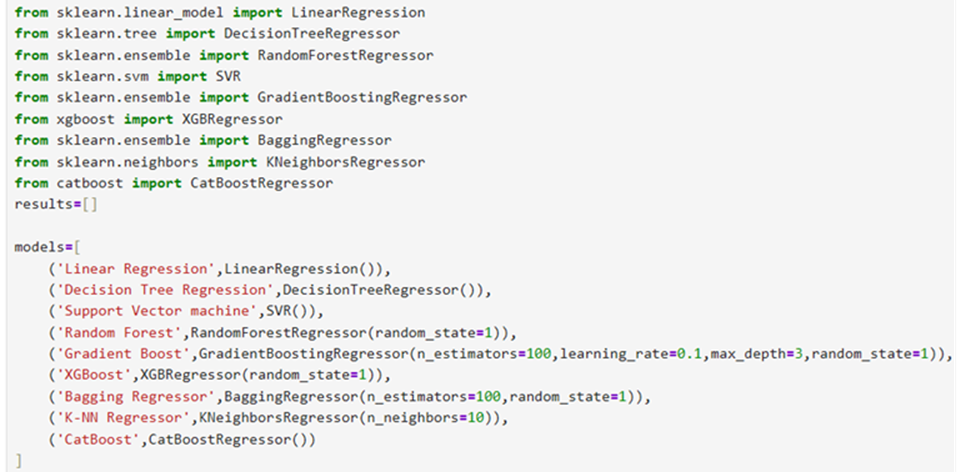
Model 1 : Linear Regression
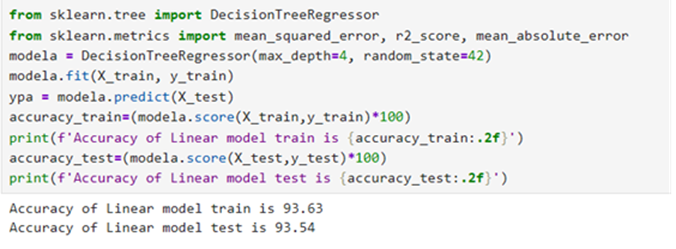
Model 2: Decision Tree Regressor
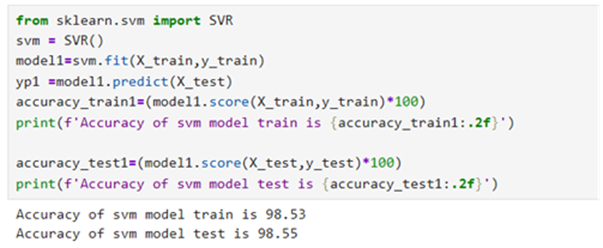
Model 3: Support Vector Machine
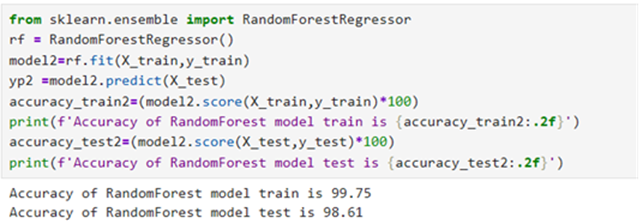
Model 4: Random Forest Regressor
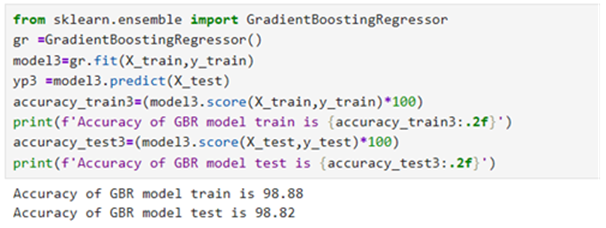
Model 5: Gradient Boosting Regressor
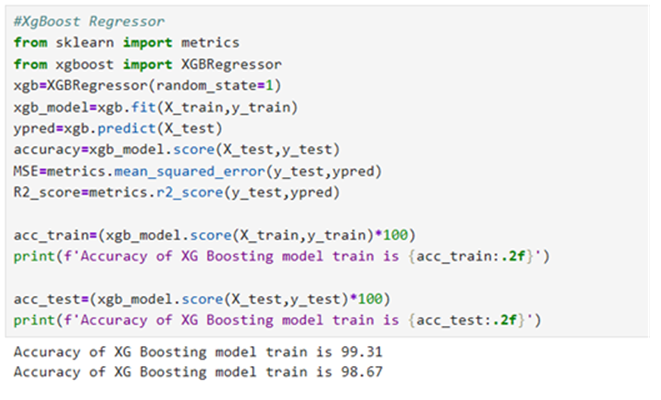
Model 6: XgBoostRegressor
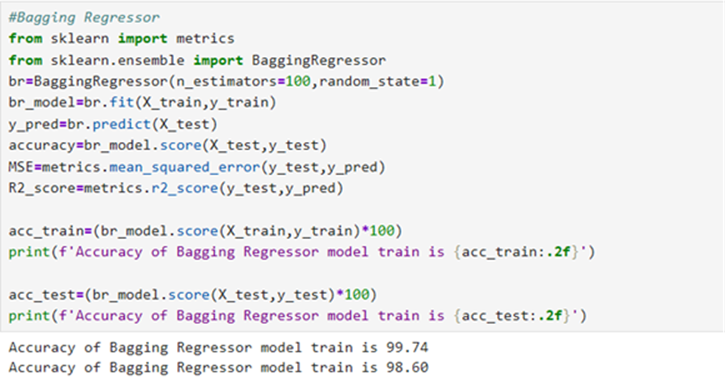
Model 7: BaggingRegressor
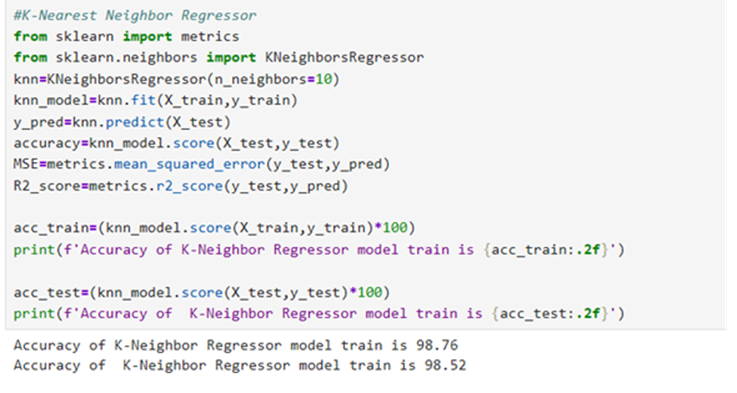
Model 8: k-Nearest Neighbourhood Regressor
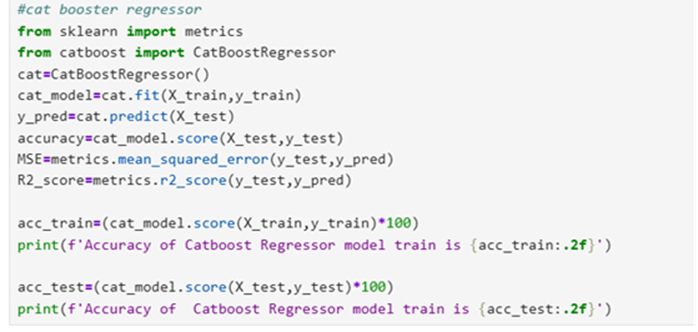
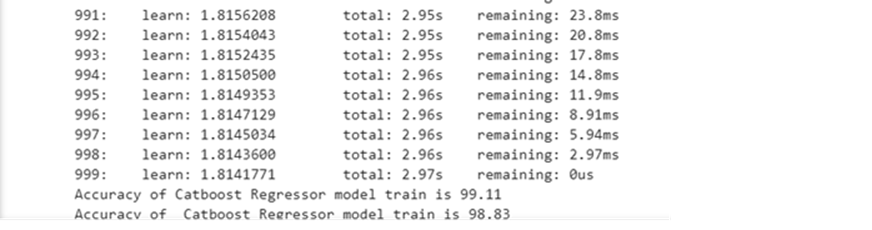
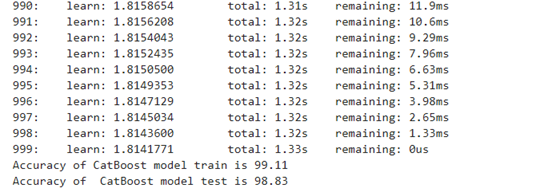
Model 9: Cat Boost Regressor
Consolidate
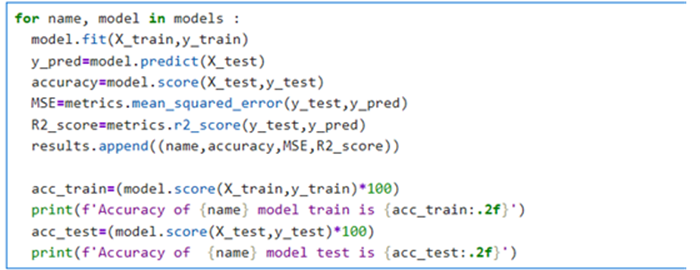
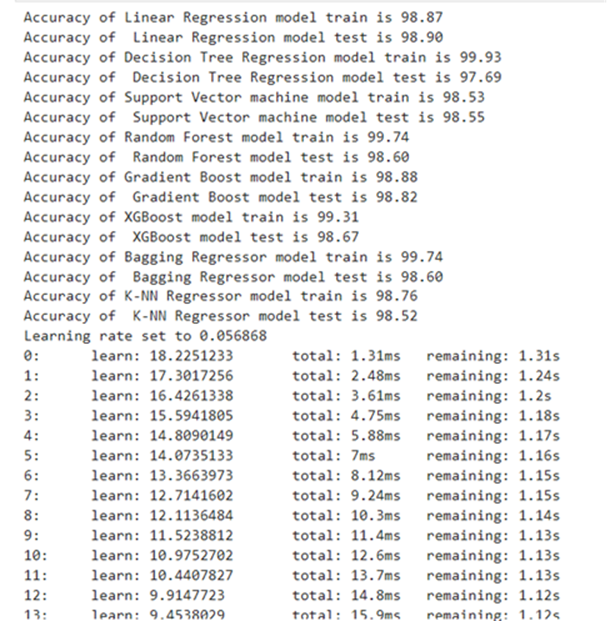
Result
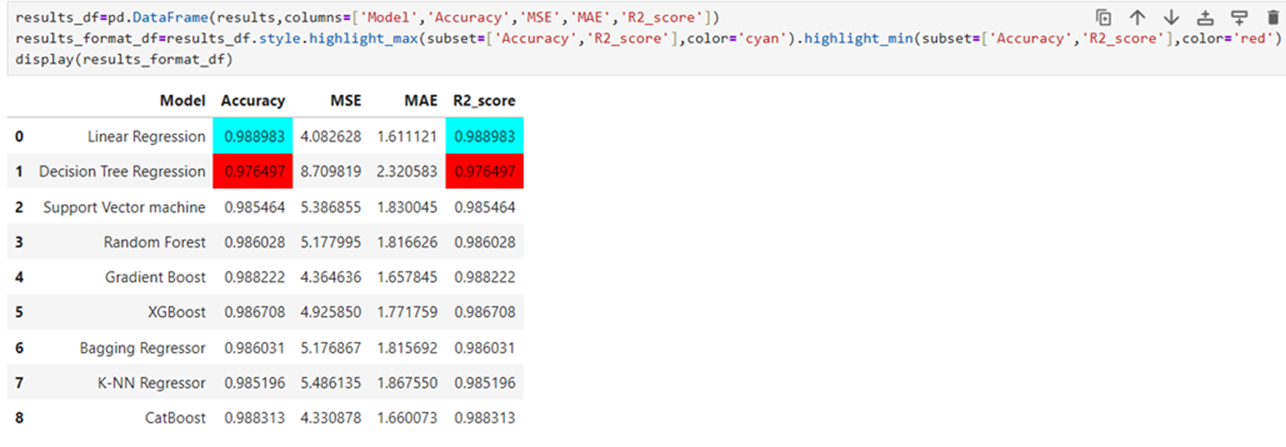
Linear Regression is the best model among the 9 models tested. The formula for finding the PerformIndex can be deployed for some time for the given data. Decision tree is the worst model because R-Squared is the lowest among the 9 models tested
Test Result in a DataFrame

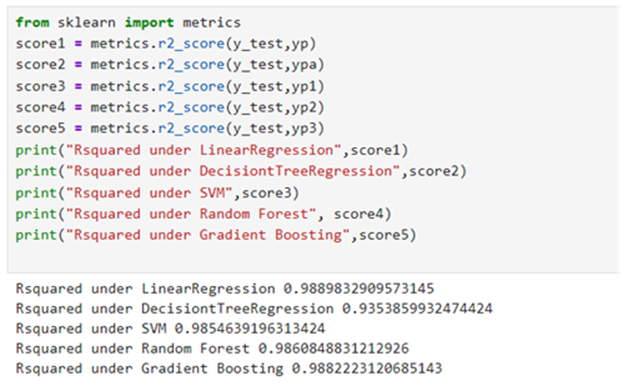
Metrics: 1 . R-squared:
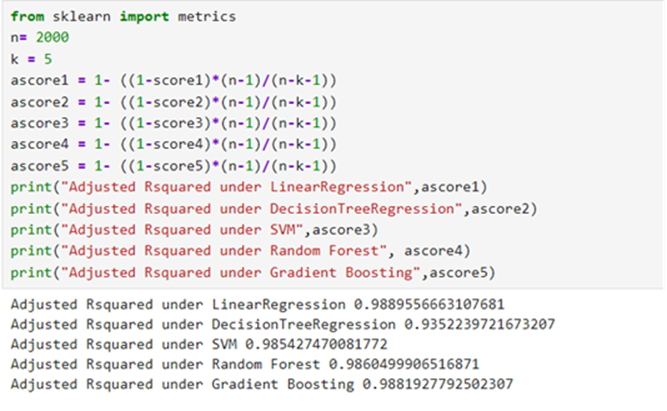
Metrics: 2. Adjusted R-squared:
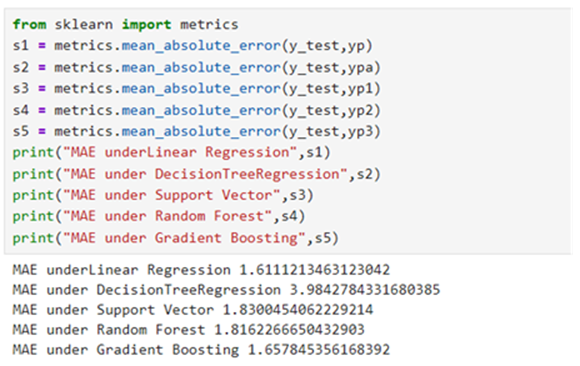
Metrics: 3. Mean_Absolute_Error:
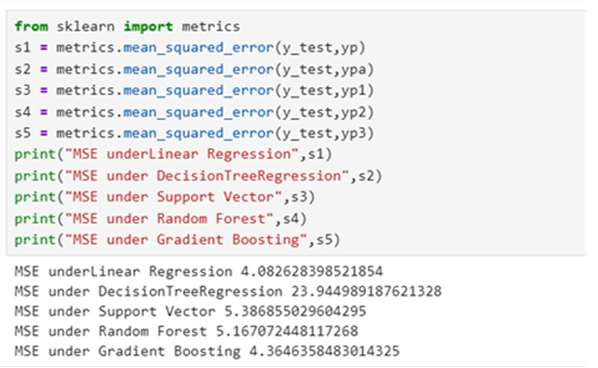
Metrics: 4. Mean_Squared_Error:
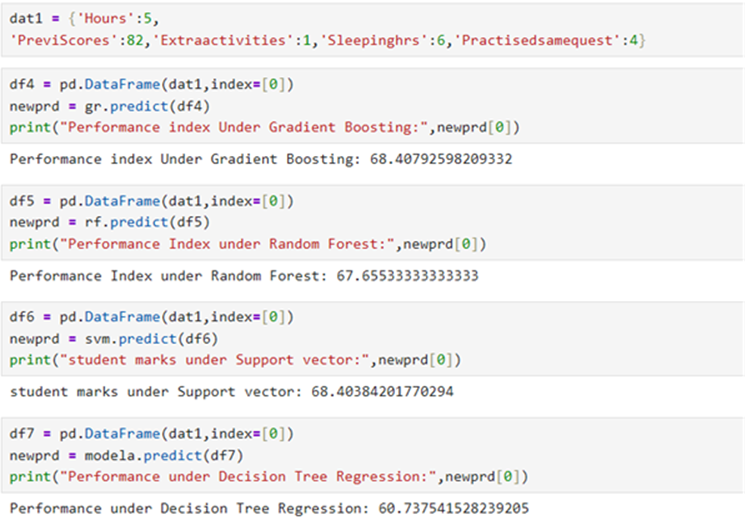
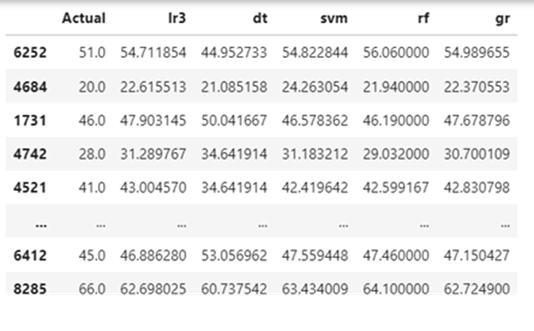
Predicted target value under different models for a given data