
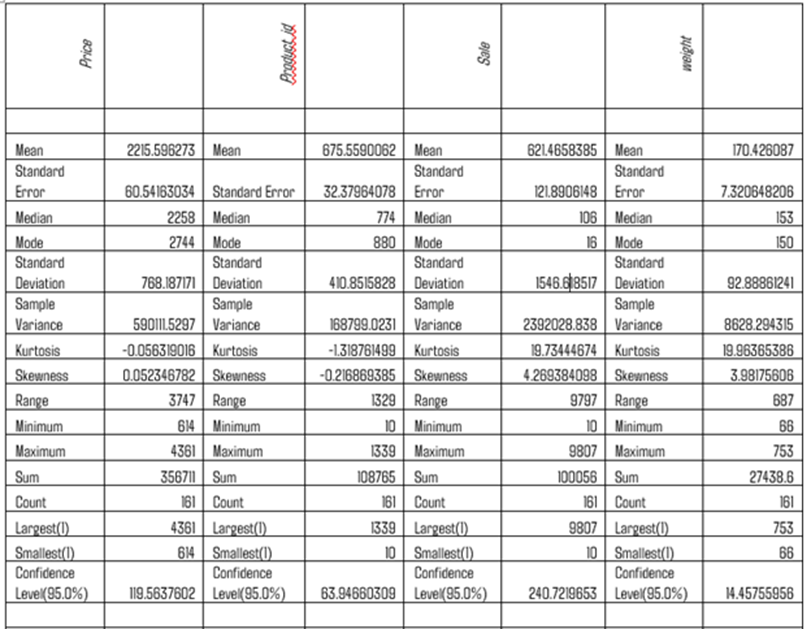
Descriptive Statistics
Go to excel >> data menu >> data analysis


Calculation of all beta coefficients using matrix in excel
Same problem. We have 161 observations and 14 variables. Price is Dependent and all others (13) are independent variables. Now add new column in front of productid column and fill with 1 as shown below. That all the first column must be filled with 1 (cover 161 rows)
| Product_id | Sale | weight | resoloution | ppi | cpu core | cpu freq | internal mem | ram | RearCam | Front_Cam | battery | thickness | Price | |
| 1 | 203 | 10 | 135 | 5.2 | 424 | 8 | 1.35 | 16 | 3 | 13 | 8 | 2610 | 7.4 | 2357 |
| 1 | 880 | 10 | 125 | 4 | 233 | 2 | 1.3 | 4 | 1 | 3.15 | 0 | 1700 | 9.9 | 1749 |
| 1 | 40 | 10 | 110 | 4.7 | 312 | 4 | 1.2 | 8 | 1.5 | 13 | 5 | 2000 | 7.6 | 1916 |
| 1 | 99 | 11 | 118.5 | 4 | 233 | 2 | 1.3 | 4 | 0.512 | 3.15 | 0 | 1400 | 11 | 1315 |
| 1 | 880 | 11 | 125 | 4 | 233 | 2 | 1.3 | 4 | 1 | 3.15 | 0 | 1700 | 9.9 | 1749 |
| 1 | 947 | 12 | 150 | 5.5 | 401 | 4 | 2.3 | 16 | 2 | 16 | 8 | 2500 | 9.5 | 2137 |
| 1 | 774 | 13 | 134.1 | 4 | 233 | 2 | 1.2 | 8 | 1 | 2 | 0 | 1560 | 11.7 | 1238 |

Polynomial models can also be considered as multiple linear regression models

Multiple linear regression can be written in the matrix form


model betas error
Our aim is to minimize sum of squares
Minimize sum of squares


First, we have to which are variables are independent and which one is dependent variables. In our case Price is dependent variable y and X are other independent variables. As explained earlier add a new column in front of all independent variable. X matrix must contain 1 in the first column
In excel we have to find our the following
- X – Cell range from Product_Id to thickness AND assign a name as X
- Xt Formula used is “=TRANSPOSE(X)” AND assign a name as Xt
- XtX Multiplication of X(transpose)*X Formula used : “=MMULT(Xt,X)”
- XtXinv Inversion of XtX Formula used: “=MINVERSE(XtX)”
- Xty Multiplication of X(transpose)*y Formula used ; “=MMULT(Xt,y)
- Beta = “MMULT(XtXinv,Xty)
X
Select the data from A2 to N162 and name the table as X
Y
Select Price column from O2 to O162 and name the table as y
Xt(transposeX) –>(=Transpose(X))

Select X variables including the first column. For output Fourteen rows and 161 columns are selected before passing the command =TRANSPOSE(X). Values goes up to from Q to FU. We have not shown the values from AK to FU columns.
Now Select the columns from Q3 to FU16 and name the table as Xt
Multiplication of Xt and X
XtX -> (MMULT(Xt,X)
| XtX | |||||||||||||
| 161 | 108765 | 100056 | 27438.6 | 838.8 | 53944 | 782 | 241.956 | 3944.776 | 355.004 | 1670.9 | 725 | 457580 | 1436.4 |
| 108765 | 100485019 | 89813290 | 18755415 | 564890.36 | 38279394 | 526900 | 167099.8 | 3159490.11 | 264821.3 | 1199014 | 510051.6 | 311974910 | 976110.4 |
| 100056 | 89813290 | 444906000 | 17422562 | 527695.23 | 41394818 | 528030 | 165080.8 | 5939330.72 | 369264.3 | 1485328 | 920361.1 | 325077695 | 866635.1 |
| 27438.6 | 18755415 | 17422562 | 6056780 | 162935.41 | 9083890.8 | 141128.4 | 43221.05 | 714610.268 | 64073.63 | 282059.5 | 123173.6 | 94923082 | 238763 |
| 838.8 | 564890.36 | 527695.23 | 162935.4 | 4734.8892 | 286950.12 | 4353 | 1333.818 | 21962.3488 | 1976.811 | 9078.48 | 3989.86 | 2662520.6 | 7200.846 |
| 53944 | 38279394 | 41394818 | 9083891 | 286950.12 | 20982772 | 287742 | 90296.24 | 1706083.64 | 144947.7 | 663059.5 | 288941.2 | 162235820 | 457776.8 |
| 782 | 526900 | 528030 | 141128.4 | 4353 | 287742 | 4754 | 1290.496 | 22272 | 2028.44 | 9593.6 | 4517.6 | 2468280 | 6378.4 |
| 241.956 | 167099.76 | 165080.84 | 43221.05 | 1333.8175 | 90296.236 | 1290.496 | 421.1776 | 7148.48 | 631.3869 | 2881.905 | 1238.86 | 749733.8 | 2029.38 |
| 3944.776 | 3159490.1 | 5939330.7 | 714610.3 | 21962.349 | 1706083.6 | 22272 | 7148.48 | 229408.164 | 15192.75 | 53814.78 | 28884.8 | 14119043.6 | 31481.56 |

This is a 14 by 14 matrix
Find inverse of XtX -> (MINVERSE(XtX))
This is also a 14 by matrix

find Xty :->(MMULT(Xt,y))


Result: Beta of features-> (MMULT(XtXinv,Xty))
Compare the Beta found using matrix with beta coefficients found using Multiple LInear Regression in Excel
