
Steps Involved
- Import data
- See the data view and variable view
- Provide codes to qualitative/categorical variables in variable view
- Report Code book
- Descriptive statistics
- Analysis
- Correlate
- Regression
- Classify
- Graph
LIBRARY USED: STATSMODELS.API
Before importing library you must have installed packages in your system. After installing the latest python 3.13.2 downloaded from the website https://www.python.org/downloads, open command line interface in your windows system. In search box type cmd you will get cmd prompt. Run as an administrator. In CLI go to your directory where you have installed python and go to Scripts directory and pass the following command
D:\python313\Scripts > pip install pandas, numpy, statsmodels,jupyter notebook
Then open jupyter notebook
D:\python313>jupyter notebook

Jupyter notebook will open in microsoft edge/internet explorer with url : localhost:8888/tree as shown below
Now press new tab and select python 3(ipykernel)

Now jupyter notebook editor opens up

Load the libraries

Read Data

We use the same data Cellphone.csv. Containing one dependent variable ‘Price’. It is continuous in nature. We have 13 explanatory variables. We have to predict the price of a cellphone based on the equation which may contain all the 13 explanatory variables or reduced explanatory variables. The data is stored in the data frame object called df
Information about the data we handle
To know the variable name, types of the data, null data if any we pass the command df.info(). we use info() for this

Total variables used are 14 (1 dependent and 13 explanatory variables).No.of observations handled are 161 and the types could be int64 or float64 or categorical
Describe the data
Use object.describe() – describe function. Here you get the number of observations of each features, mean, std, minimum, maximum first quartile, median, third quartile values

If you want to see the above in a tabular form use object.describe().T

Find the shape of the data

PRE-PROCESSING THE DATA: Find if any null values exists
Use object.isnull().sum()

No null value exists. If null values/ missing values found the system will not proceed further. It will show error message
Separate dependent and independent variables from df
Dependent variable will be called as target variable
independent variables will be called as feature variables. use object.drop function to separe the target variable ‘price’ and assign it to X. use axis=1. Assign the df[‘Price’] to y

Find mean, variance, standard deviation of all features using program


Output

Convert random variable X and y as array with float64 type

Ordinary Least Square using Statsmodels.api
import statsmodels.api as sm


Find metrics using statsmodels.api


Once Again Read Data:


Standard Error of Betas using Python Program


Library Used: SKlearn without spliting the data


Box Plot

Bar Plot


Linear method (sales vs price)
sns.lmplot(data=df, x=’Sale’,y=’Price’)


Residual plot


Metrics

output

Using sklearn with spliting of given data
once again read data

Separate features and target

Split data into training and test data sets

Model Parameters(Coefficients and intercepts)

Metrics for split method

Lazy predict – Supervised Learning
Install Lazy predict using pip install Lazy predict


IDENTIFY WHICH MODEL IS BEST AND WHICH MODEL IS WORST FOR THE GIVEN DATASET
results_df1 = pd.DataFrame(models, columns=[‘Model’,’Adjusted R-squared’,’R-squared’,’RMSE’,’Time Taken’]
results_format_df1 =results_df1.style.hightlight_max(subset=[‘Adjusted R-squared’,’R-squared’],color=’green’).highlight_min(subset=[‘Adjusted R-squared’.’R-squared’],color=’red’)
display(results_format_df1)


Predictions


Load libraries

Accuracy of different models:
Linear Regression

Lasso Regression (L1 Regularization)

Ridge Regression(L2 Regularization)

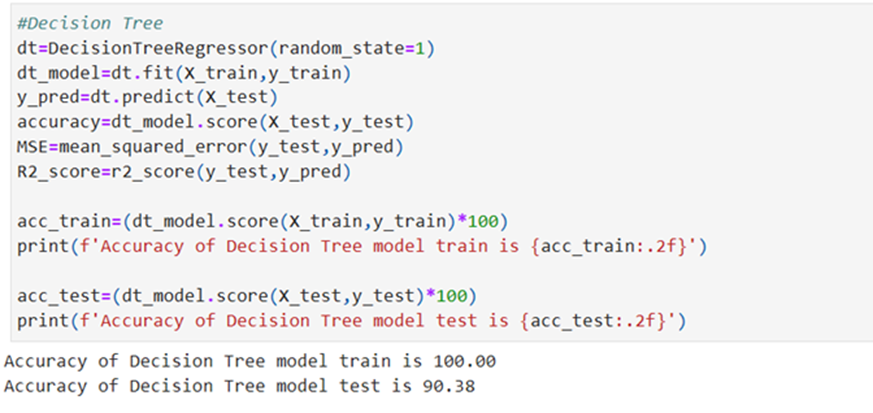
Decision Tree Regression Model
Random Forest Regression Model

Gradient Boosting Regression Model

XGBoost Regression Model

Bagging Regression Model

K-Nearest Neighbourhood Regression model

CatBoost Regression Model


Combine all results


Results:

XGBoost Regression model gives the highest R-Square 98.42% and KNN model gives the worst R-Square. 16.32%