Load data from csv file to R by using read.csv function. Then convert it to data.frame. Then assign individual column to different variables. Now find regression using linear model (lm function) print summary of the regression. Then predict the value of y when x = 40
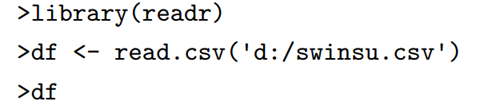
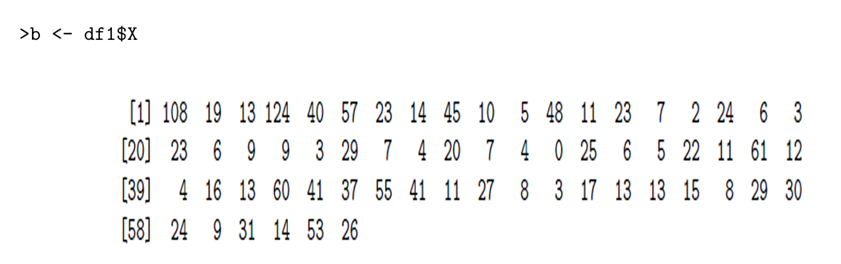
show the data in R

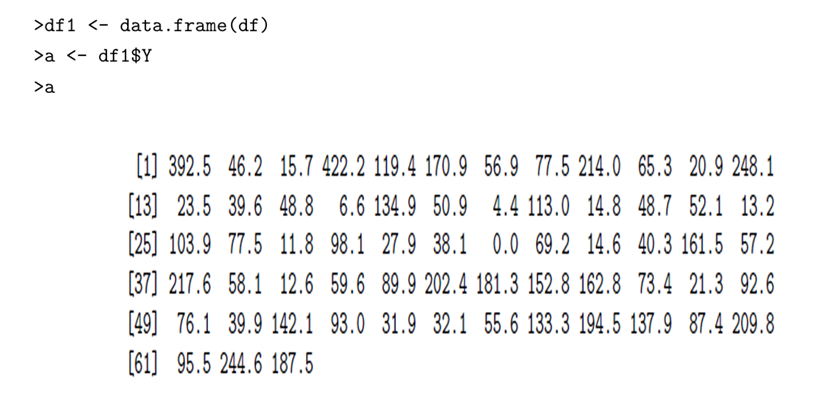
Assign y dependent variable to a
Assign X independent variable (feature) to b
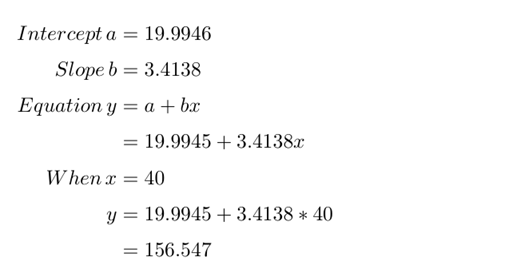
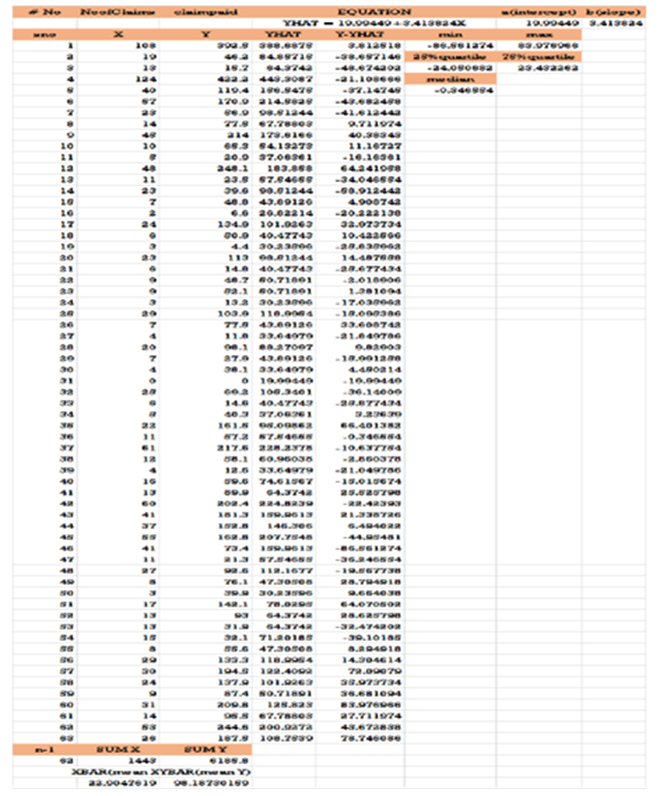
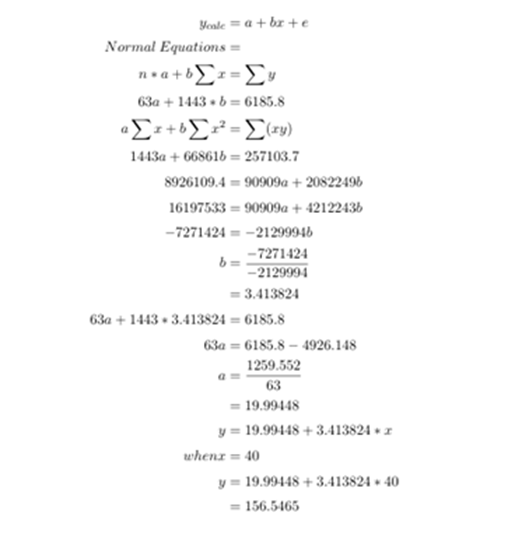
simple linear Regression Equation:
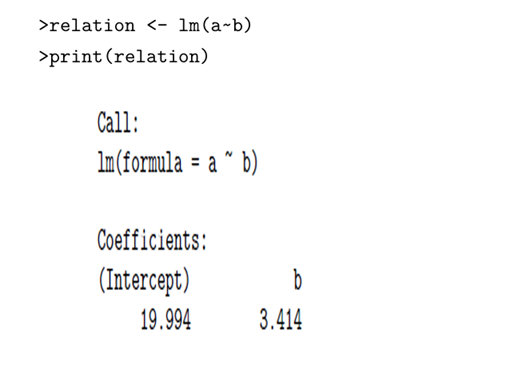
y = 19.994 +3.414x
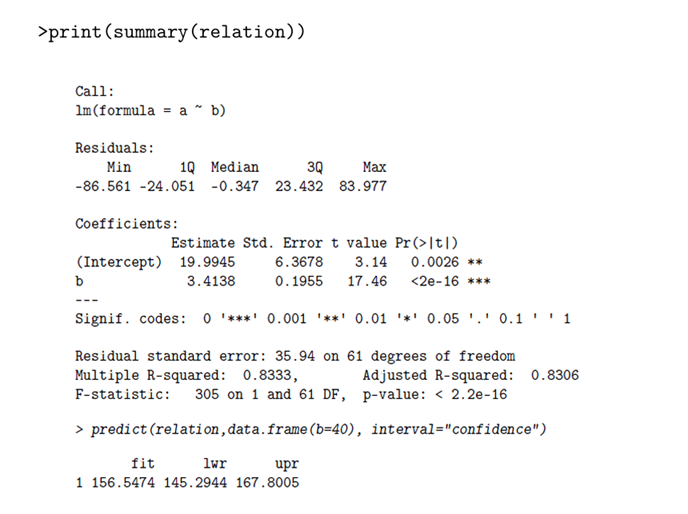
Summary:
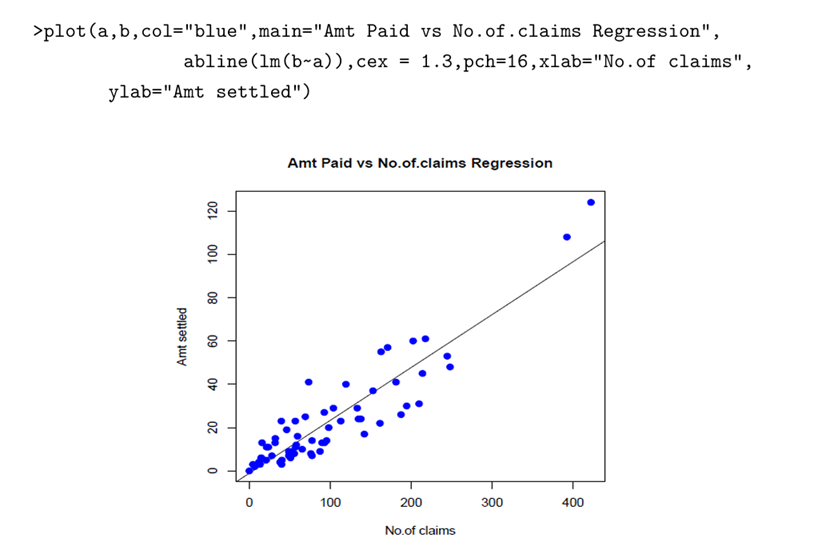
Plot the simple linear regression line of y on x
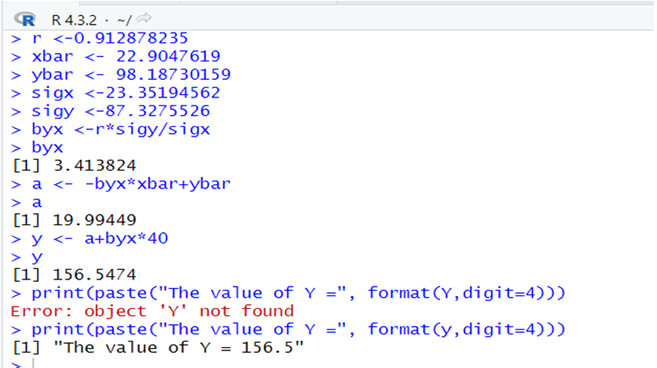
Result: The value of y and when x =40
PROBLEM 2:
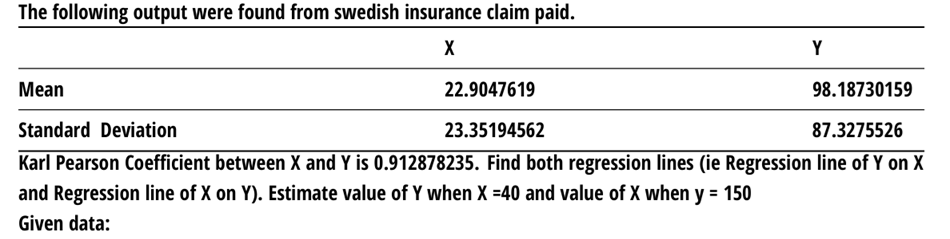
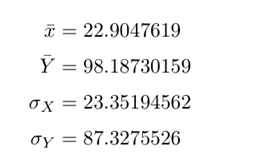
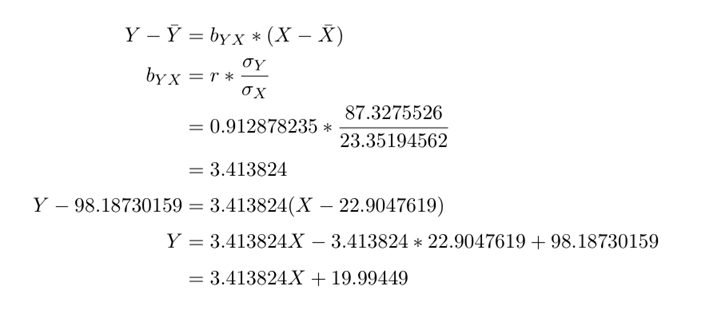
Regression line of Y on X
Using R
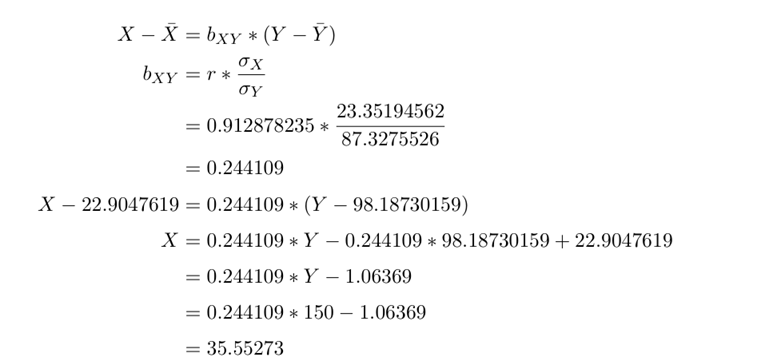
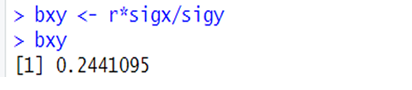
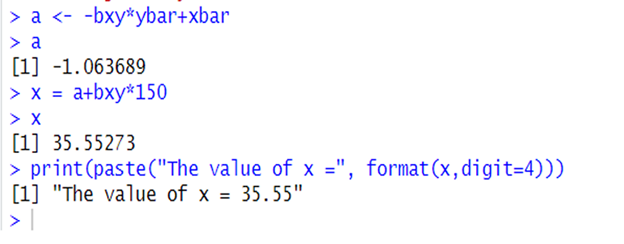
Regression line of X on Y
Regression Analysis
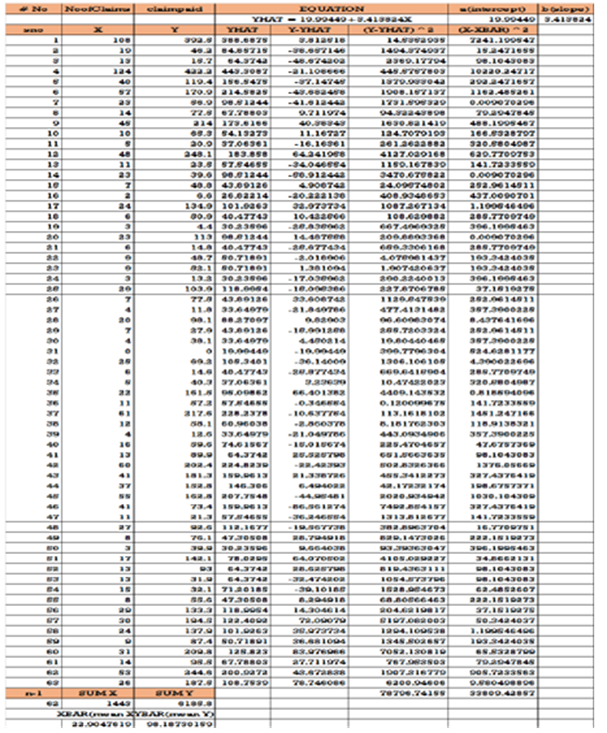
Regression analysis enables you to estimate the relationship between dependent and independent variables. How dependent variable varies when one unit of value of independent variables change. It is used for prediction and forecasting. Regression Equation is arrived at by using coefficient Estimates for Intercept and slope. Under Least Square Method the following things are to be

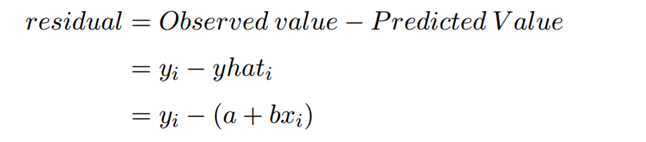
Residuals
Residuals are nothing but differences between observed values and calculated values
Summary
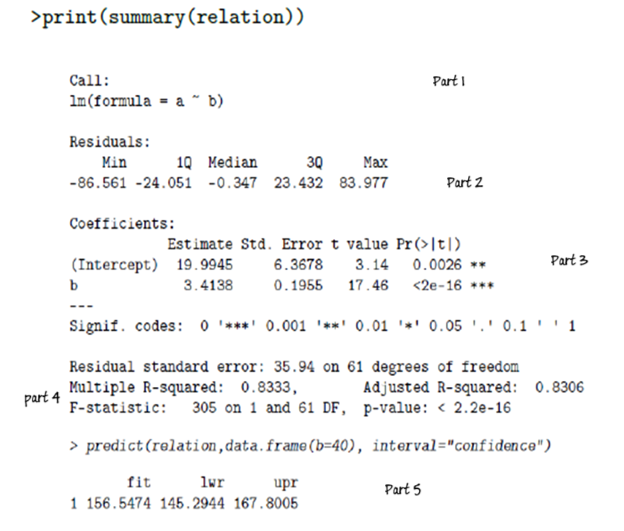
Part 1:
Calling the formula lm(formula= a~b)
Part 2:
Display the residuals
Min (Minimum residual)
1Q (25% residual (first quartile))
medin (50% second quartile)
3Q (75% residual)
Max (Maximum residual
Part 3:
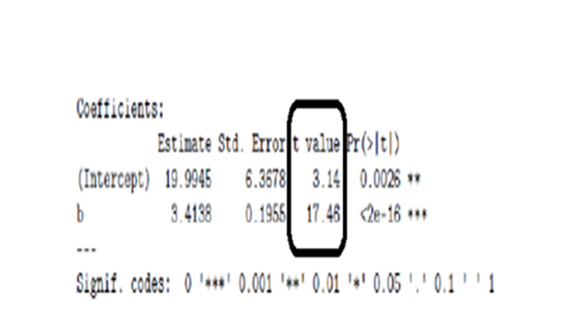
Part 3: Coefficient-estimates for Intercept and slope
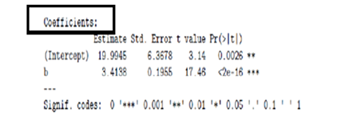
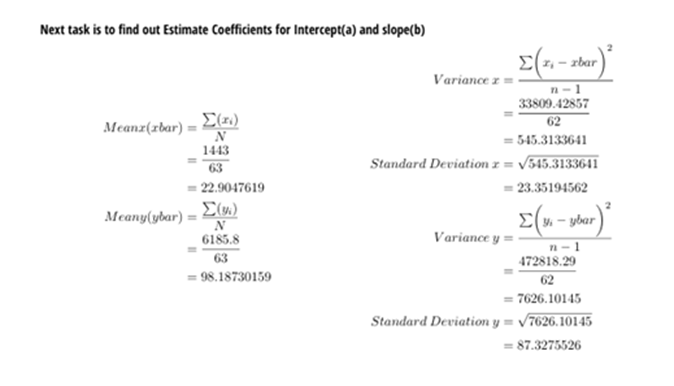
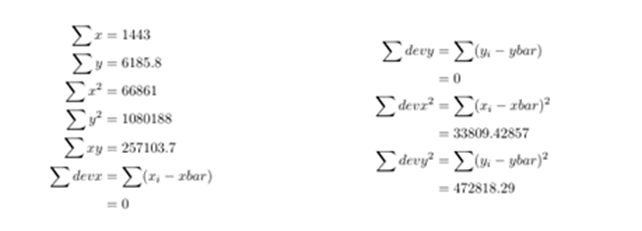
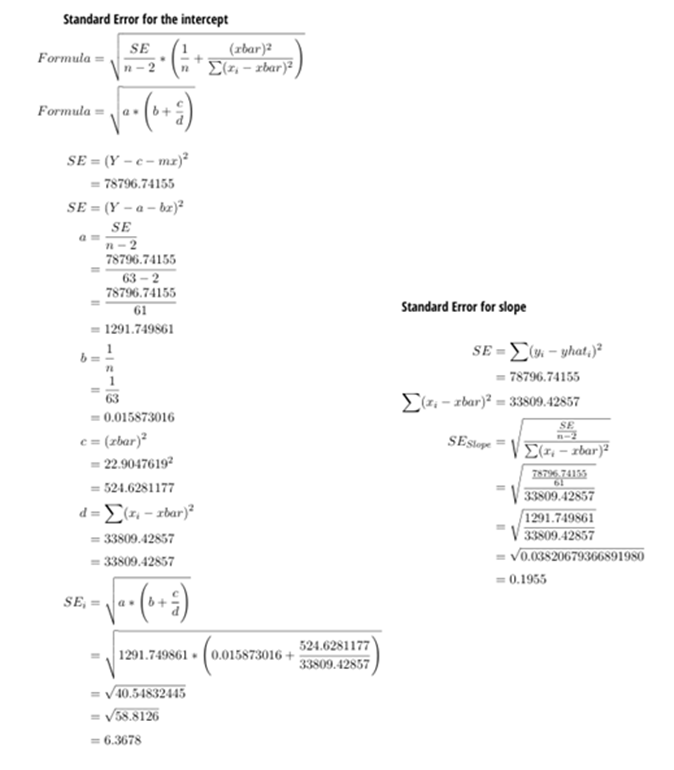
Standard Error for Intercept and slope
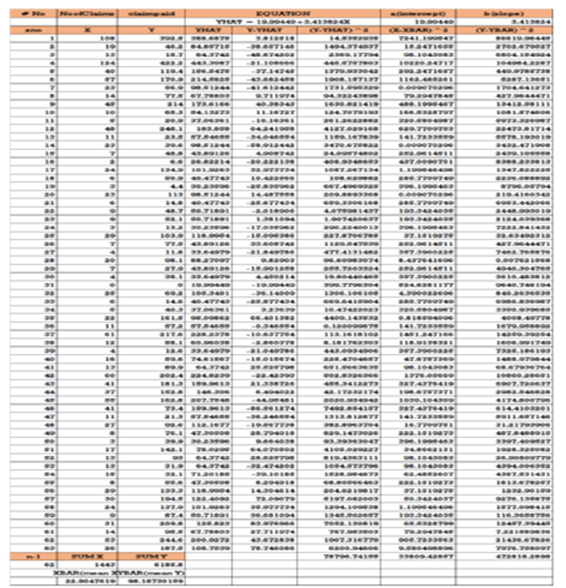
After finding out b (slope) and (intercept) a we can find out the calculated value of y for each observed value of
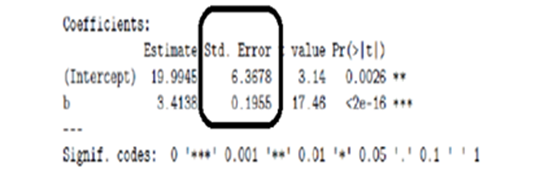
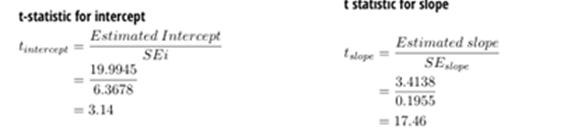
Coefficient – t-statistics
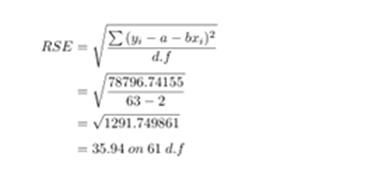
Residual Standard Error
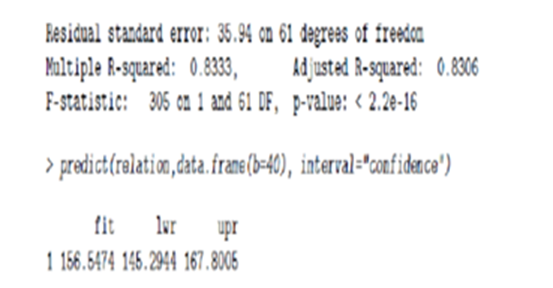
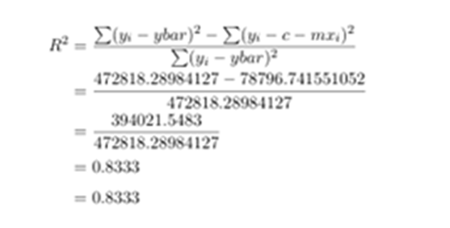
Multiple R-Squared:
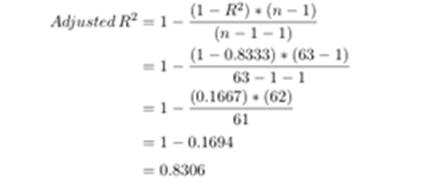
Adjusted R-Squared
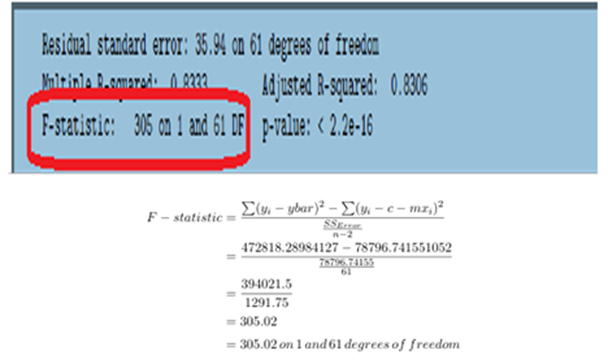
F-Statistics
P-Value
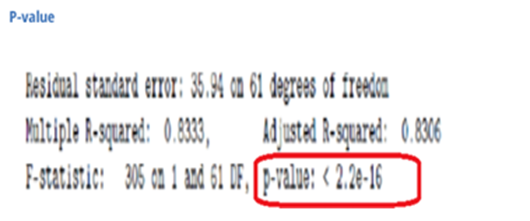
Based on the t-statistic test statistic and the degrees of freedom, we determine the P-value. P-value is the smallest for which we can reject Null H0. P-value can be found out in three ways
1. p-value for a right-tail test
2. p-value for a left-tail test
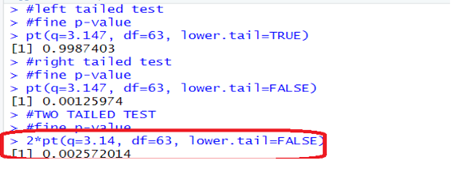
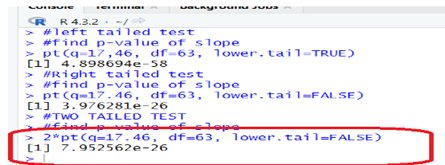
3. p-value for a two-tail test
p-value for a right-tail test
p-value for a left-tail test
If the area under sampling distribution falls to Left of test-statistic of the test
p-value for a two-tails test
If the area under sampling distribution falls to Right of plus test-statistic of the test and falls to left of minus test-statistic of the test
p-value using excel
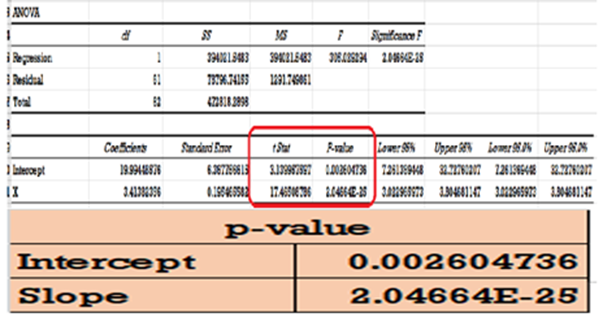
In excel we use formula TDIST(tvalue,d.f,tail). For p-value of intercept we have to use TDIST(3.13995759693781,61,2) and for slope TDIST(17.4650878615404,61,2). t-value must be absolute and not negative. If use negative you will get result as not a number
p-value using R
To find p-value associated with a t-score in R, we can use pt() function. follow the syntax as shown below
pt(q, df, lower.tail = TRUE)
where:
q: The t-score
df: The degrees of freedom
lower.tail: If TRUE, the probability to the left of q in the t distribution is returned.
If FALSE, the probability to the right is returned. Default is TRUE