
As we explained we have to apply different type of feature scaling
|
Model |
Requirement |
| Tree based models: Random Forest and Gradient Boosting | Do not require feature normalization or scaling |
| Neural Networks | Require feature normalization as the model converges more quickly. Beneficial to Neural network model |
| Selection of appropriate feature scaling / normalization techniques | Is important step in pre-processing of the dataset given on hand |
Z-Score Normalization:
- It is a data pre-processing technique.
- It Rescales features to have mean = 0 and standard deviation = 1.
- It is sensitive to outliers: Since mean (µ) and standard deviation (σ) are influenced by extreme values.
- Achieved by centering data around the mean and scaling it based on the feature’s standard deviation
- Works well when the data distribution is approximately Gaussian (normal).
- Effect on models:
-
- Beneficial for algorithms assuming normal-like distribution (e.g., linear regression, logistic regression, LDA).
- Improves gradient descent convergence for models like neural networks.
- Distance-based models (KNN, SVM) perform better when features are standardized.
Here we convert the normal variate X into Standard Normal Variate Z using the formula
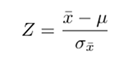
Each normal variate X is converted to Z
Function used for this Normalization technique
def z_score_standardization(series):
return (series – series.mean())/(series.std())
Then call this function using your independent features after dropping dependent variable feature
Let us download teleco Customer Churn dataset from https://www.kaggle.com/datasets/royjafari/customer-churn
It is a free data.
You can refer the following publications:
- Jafari-Marandi, R., Denton, J., Idris, A., Smith, B. K., & Keramati, A. Optimum profit-driven churn decision making: innovative artificial neural networks in telecom industry. Neural Computing and Applications, 1-34.
- Keramati, A., Jafari-Marandi, R., Aliannejadi, M., Ahmadian, I., Mozaffari, M., & Abbasi, U. (2014). Improved churn prediction in the telecommunication industry using data mining techniques. Applied Soft Computing, 24, 994-1012.
- Keramati, A., & Ardabili, S. M. (2011). Churn analysis for an Iranian mobile operator. Telecommunications Policy, 35(4), 344-356.
Or you can download using the following algorithm
import kagglehub
# Download latest version
path = kagglehub.dataset_download(“royjafari/customer-churn”)
print(“Path to dataset files:”, path)
The data contains 3150 rows (records) and 13 features and one Dependent variable (Churn)

There were two more features called FP and FN. I have removed them.
Load libraries and read the data


View the size and type of features you handle:

Check if any null values are present

See the Descriptive Statistics of your data


Correlation heatmap:


Boxplot Before using normalization of features


Logistic Regression using SK Learn library

Predict yhat using features

Find Coefficients and intercept

Find R^2 (R-Square)

R^2 works out to 19.94% when no normalization technique is used
Arrive at Confusion Matrix

Confusion Matrix heat map using seaborn and Matplotlib


Find Accuracy:

Find Precision and Recall

Find F1-score

Classification Report
Regular denotes customer who are not defaulting customer
Default denotes customers who may churn and go away from the telephone company

Accuracy of the model is 89.40%
Out of 3150 customers 2655 customers appear to be regular who may not churn from the company (84.28%)
Out of 3150 customers 495 customers appear to change their mind and churn away from the company (15.72%)
ROC-AUC calculation:


Another way to calculate accuracy, precision, recall, f1-score and AUC


Z-Score Normalization Technique
Define a function and normalize features


BOXPLOT after z-score normalization


Logistic Regression using normalized data with the help of stats.models.api library


Yhat(churn) =-3.5030+0.9551*callfailure +1.0746*complains-0.2563*Subscription Length-0.6307*chargeamt+0.4560*secondsused
-3.1738*Frequency of use -5.2897*freqofsms-0.1901*distinctcallno+0.0764*agegrp+0.0617*tarriffplan+0.6092*status
+0.0346*Age +4.2785*custvalue
Logistic Regression using SKLEARN lib

Predict churn

Find Coefficients and intercept

Find R-Square for Z-Score Normalized Data:

Confusion Matrix

Confusion Matrix heatmap


Classification Report

Accuracy

Precision, Recall and F1-score

ROC-AUC


Accuracy, precision, recall, f1-score and AUC with a single program

Comparison of matrices with Original data and normalized data

R^2 has increased when we use normalized data.