We know that we have been handling with Descriptive Statistics and Inferential Statistics.
Statistical Inference: It is a process of generalizing and deriving statistical judgements. Here we estimate population characteristics of given data from the sample characteristics. Samples are drawn from population
We derive statistical inference using the following forms
- Estimation
- Null hypothesis tests of Significance
ESTIMATION
While studying Statistics, we come across the terms like Point Estimates, Interval Estimates, Good Estimator, Confidence Level, Confidence Interval. Let us learn them one by one.
In real life we have been dealing with samples only. So, we have to estimate the population parameters like mean(µ), variance, and proportions from Sample statistics like mean(xbar),variance and proportions. Let us also discuss about standard error and the probability of accuracy of the estimates of the population parameters.
In every day we have been estimating a number of things.
Say I am standing on a busy road. I have to cross the road. In order to safely cross the road, I look if any vehicle come on both sides of the road. If yes, I have to estimate the speed of the car and the speed with which I walk. Can I cross the road safely with my walking speed? Estimation plays important role and I take a decision whether I have to run or to walk before the vehicle crosses the spot
At the time of granting a loan, the banker estimates if the borrower will pay the loan in time or not. He also estimates if the interest rate will remain constant throughout the life of the contract or fluctuates. If fluctuation is expected he has to estimate if fixed rate will be beneficial or floating rate is beneficial. Accordingly, he will fix the price
Estimates: We deal with two types of estimates when we try to estimate the population parameters from sample statistics.
- Point Estimation
- Interval Estimation
Point Estimate:
Here we use a single value to estimate an unknown population parameter. Say We estimate that 800 out of 1500 students will pass the exam in mathematics in a particular school from the current data. It is a point estimate. It is not an accurate population mean. It may happen or may not happen. It may go wrong. It does not accompany with estimate error. You can not rely on point estimate when we try to estimate population parameter from the sample statistics.
Interval Estimate:
Statisticians are satisfied with a range of values and declare that the estimation of population parameter may fall within a range of values. Error associated with the estimation is covered with the range of values. In school admission we estimate that 500 to 650 students may be enrolled in Chemistry course. It gives a clear idea about the number of students who may take Chemistry course in the coming year. It enables the school authority to fix the number of sections for the students who may be enrolled. Here it enables to fix 5 or 6 sections so as to accommodate the students who will enrolled in the coming year. Based on the range school may either increase or decrease the number of sections.
Estimator:
We use sample statistic to estimate the population parameter. Sample statistic is called an Estimator. It could be
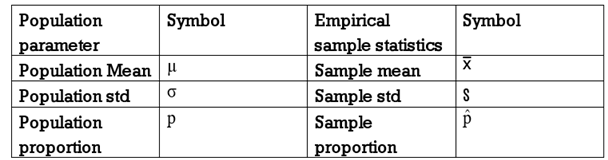
- Mean (xbar) -> µ(population mean)
- Variance (s2) ->Variance (Population Variance))
- Proportion (pbar) -> p (population proportion)
- Sample range -> population range
Characteristics of a Good Estimator:
- Unbiased: To remain a good Estimator it must remain Sample mean is an unbiased estimator of a population mean as the mean of sampling distribution of sample means drawn from the same population. Sample mean will be equal to the population mean. When the sample size increases the mean of sample tends to assume the value of population mean
- Efficiency: Desirable characteristic for a good estimator. Efficiency refers to the size of standard error of the statistic. Say we compare two statistics like mean and median. Which one is more efficient estimator?
- Let us choose a sample of certain size. Now problem arises on which sample statistic we have to choose 1) sample mean or 2) sample median. From the given data we find the standard error for both
- Standard error of the sample mean is 1.87
- Standard error of the sample median is 2.01
- Sample mean is a good estimator as the standard error of sample mean is less than the standard errof of sample median. Both are the estimators. However, the estimator coming with a small standard error is treated as good estimator.
- Consistency: Any sample statistic is treated as a consistent estimator if the value of sample statistic comes very close to the value of population parameter at the time when sample size increases. The consistent estimator is reliable with large samples. If your sample statistic is consistent you need not increase the size of sample and waste your time and money in mobilizing large samples.
- Sufficiency: an estimator is sufficient if it provides required all information in the sample. For sufficiency the sample must be large so that the estimation of population parameter will be accurate.
Acronyms
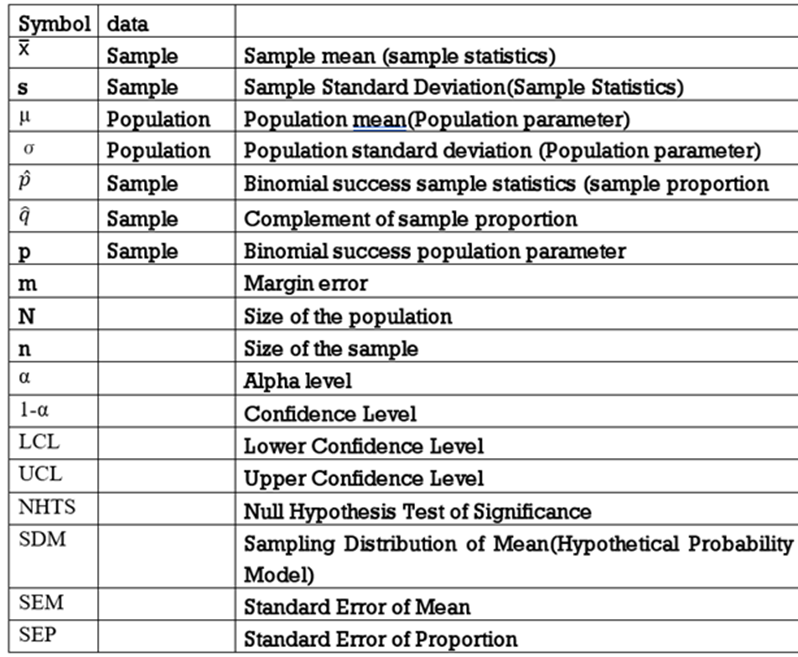
Symbols used for Population Parameters and Sample Statistics
Point Estimate:
The sample mean ü is the best estimator of the population mean as it possesses all the required characteristics of a good estimator. It is unbiased, efficient and consistent and if we take a large sample it possesses the last characteristics of sufficiency also.
Problem 1:
The CCI Stadium wants to expand its seating capacity and needs to know both the average number of people who attend events there and their variability in number. The following are the attendance in thousands at nine randomly selected events. Find point estimates of the mean and variance of the population from which the sample was drawn.
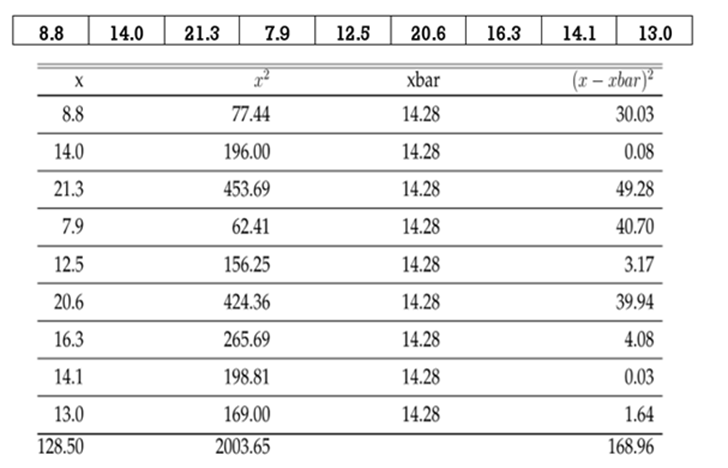
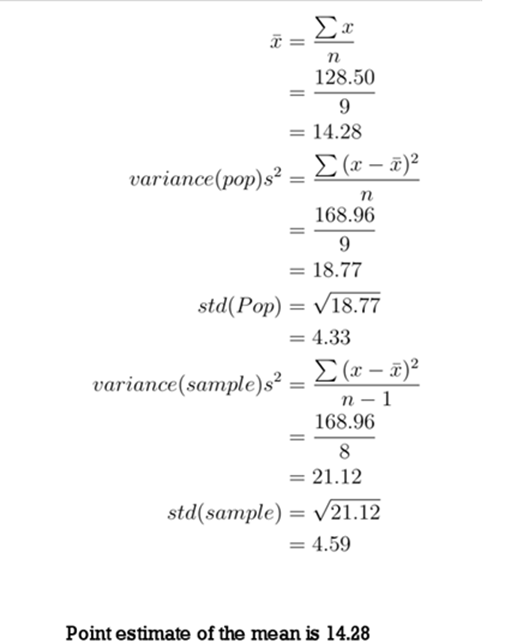
Point estimate of the variance is 18.77
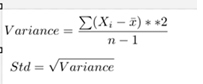
This estimate may be biased. When finding population variance we have to find out sample variance using the second formula instead of the first formula
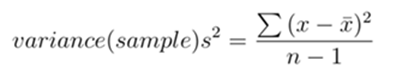
Where X is the individual items in a sample and ü is the mean of the sample and n is the sample size. Variance Sample s2 is the unbiased estimator for the population variance.
In the above case we found
- Population parameter mean µ from sample statistic (mean)ü
- Population parameter variance s2 from sample statistic (variance ) s2
Point Estimate of the Population Parameter -proportion
Another population parameter – proportion (p) can be estimated from sample proportion ( ). Say a manufacturer of wet grinders wants to estimate the number of grinders which are reported as damaged during the transit period when they are supplied to the vendors through a particular lorry service. Out of a sample of 100 grinders, due to mis-handling, the reported damaged wet grinders were 8. It means the proportion of damaged sample is is 8/100= 0.08. Sample proportion is a good estimator. We can estimate the population proportion which may go damaged from the sample proportion. Point estimate of population proportion in our case is 0.08. The draw back here is that it does not account for any error. You know that the standard error may increase or decrease based on the sample size what we handle. In order to make our estimate more accurate we go in for Interval estimate.
INTERVAL ESTIMATE:
We know that the population parameter is always fixed. However, our point estimate of the population parameter from the sample statistic may not be 100% accurate. So, we may expect that the estimate of population parameter may fall in between range of two values. Lower and upper. Instead of relying on a point estimated value let us certainly say that the estimate of population parameter based on point estimate of sample statistic may fall within some interval. So, we call it a Interval estimate
Example:
Point estimate of the population mean is 14.28
It is found based on sample items. Population mean could be less than or greater than 14.28. Say could be 14.00 or 14.56. Population mean could fall in between these two values. We can also define interval estimate with certain 95% confidence interval.
Note: Interval Estimate describes a range of values within which population parameter will fall.
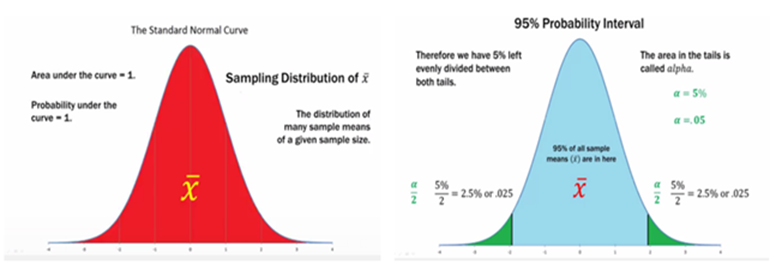
Say we have hundred samples drawn from the same population. We have already found out means of each hundred samples. The distribution means of sample means will approximately show a normal curve. Finally, the mean of all sample means will be equal to population mean.
Problem:
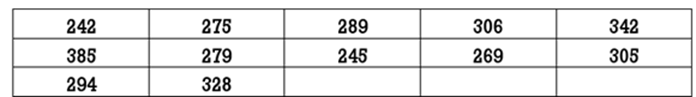
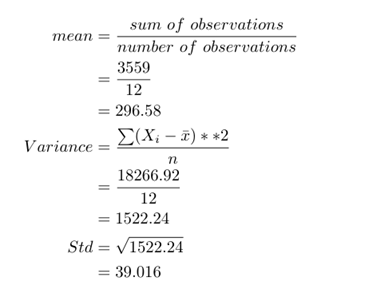
A bank is trying to determine the number of tellers available during the lunch period on Fridays. The bank has collected data on the number of people who entered the bank during the last three months on Fridays from 11 a.m to 1.00 pm. Using the data below, find point estimates of the mean and standard deviation of the population from which the sample was drawn.
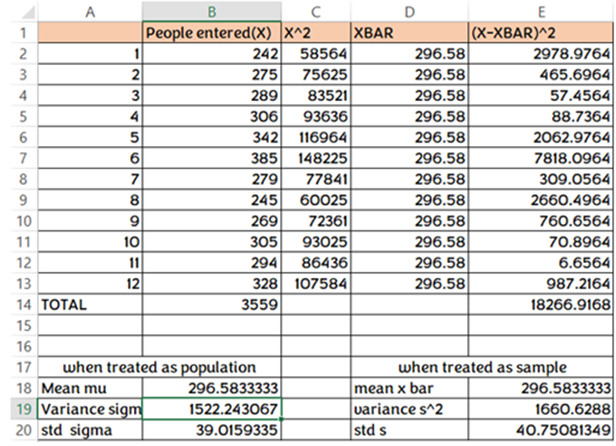
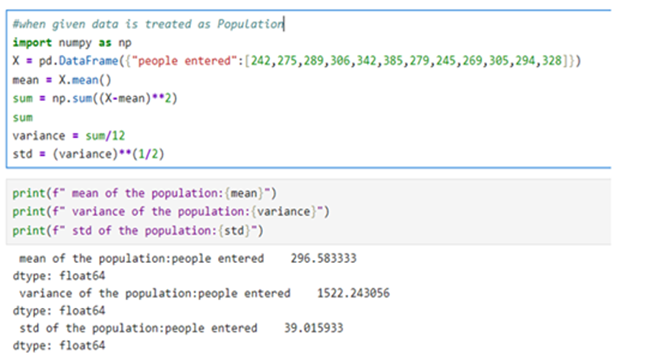
When give data is treated as population:
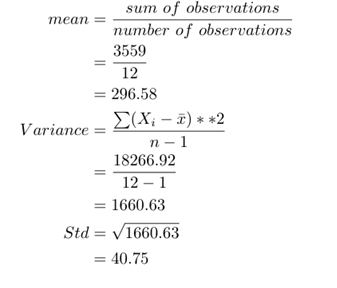
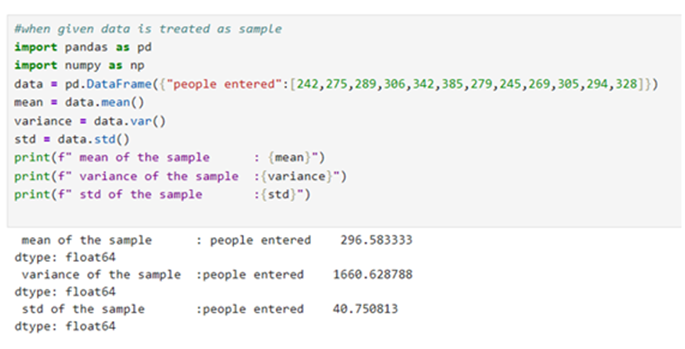
When a given data is treated a sample
Interval Estimate:
You can find Interval Estimate of population in the following ways
- Interval Estimate of Population parameter using mean plus or minus 1*standard deviation or 2*std or 3*std
- Interval Estimate of Population parameter when population is infinite and when population standard deviation is known
- Interval Estimate of Population parameter when population is infinite and when population standard deviation is not known
- Interval Estimate of Population parameter when population is finite and when population standard deviation is known
- Interval Estimate of Population parameter when population is finite and when population standard deviations is not known
Interval Estimate of Population Parameter when Population is INFINITE(Std of Population is known) using Z-Probability Distribution
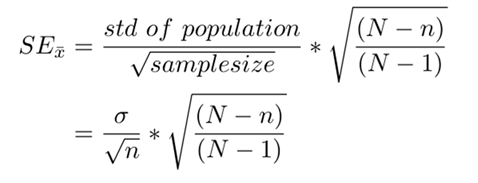
To find out interval estimate of the population we have to compute Standard Error of means.
Under infinite population we require
- the standard deviation of the population
- size of the sample (n)
Simple Random Sampling with Replacement:
SE_{XBAR} = {Std of Population}/√{sample size}
interval estimate = estimated mean ± (z*SE_{Xbar})
where z is the critical value for X% confidence level
Interval Estimate Lower Limit of confidential Interval and Upper Limit of Confidential Interval. Interval estimate of the population may fall inbetween these two – Lower limit and upper limit
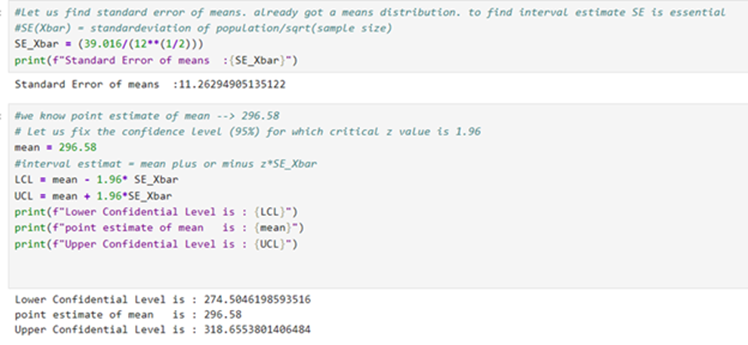
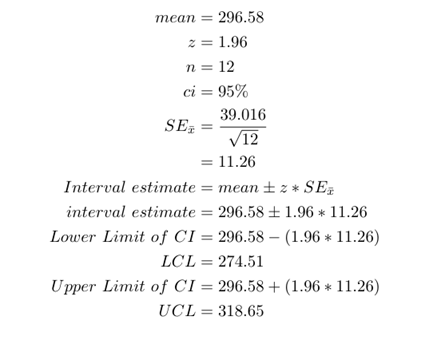
Population parameter may fall i n between LCL and UCL (274.51,318.65)
Interval Estimate of Population Parameter when Population is INFINITE(Std of Population is not known)
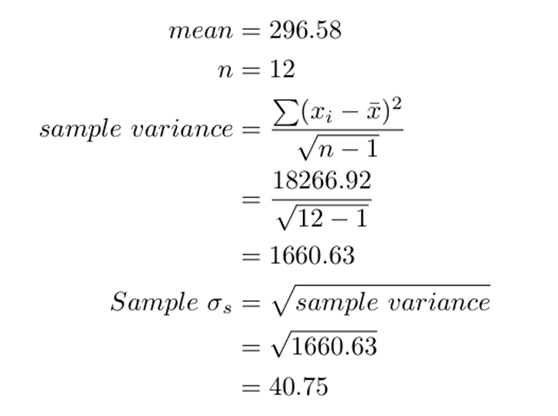
In this case we have to first find out standard deviation of the sample and Using the same we have to find out standard error of mean(parameter)
In the above-said problem we found out mean, variance and standard deviation of the sample means.
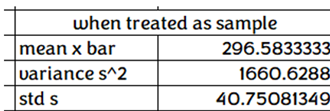
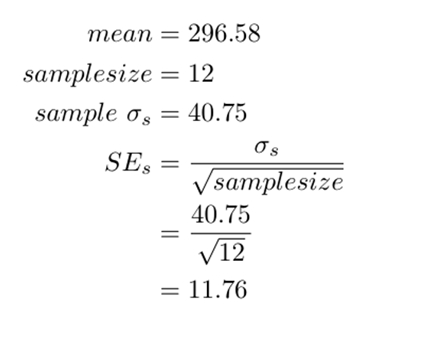
Sample standard deviation is 40.75. Now find out Standard Error of the mean of the mean distribution
FIND SAMPLE STANDARD DEVIATION:
Here instead of dividing the sum of (xi-xbar)^2 by n(actual number of observations) we do as follows
Now let us use the standard deviation of means distribution and find out the SEsamplemean
FIND STANDARD ERROR OF SAMPLE MEAN
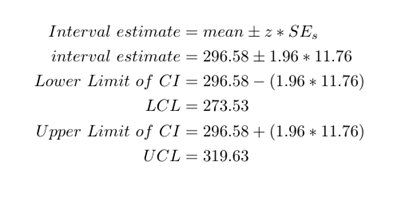
FIND INTERVAL ESTIMATE:
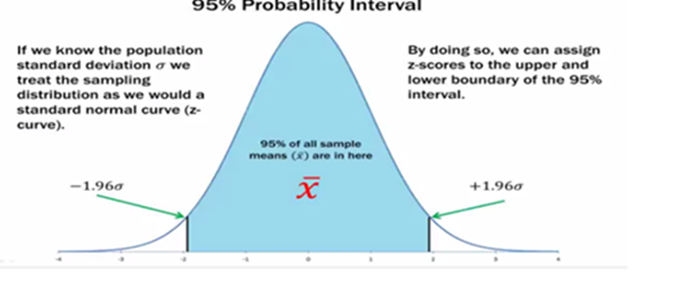
When we want to find interval estimate with confidential interval say 68.2% or 95% or 99.7%
We have assumed 95% confidence level. Z critical value for confidence level of 95% is 1.96
Interval Estimate of Population parameter when population is finite and when population standard deviation is known
Let us consider a finite population of 5 boys (A, B, C,D, E) whose heights are expressed in cm. The mean of population works out to 162.4 If we take sample size of 3, that is if we select 3 boys in each sample, we will get samples ie., 10 samples. Sample means form a sampling distribution. You can find out the mean of sampling distribution by adding all sample means and divide by the number samples selected.

Population size = 5 = N; Mean /average weight of 5 boys = (160+162+164+170+156)/5 =162.4
Variance of population:
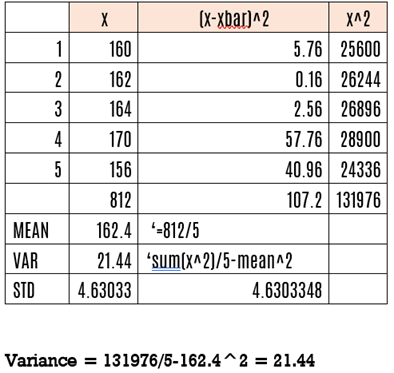
Std of population = sqrt(21.44) = 4.63033
Sampling distribution:
All possible samples when we take 3 samples from 5 students
Population size : N= 5
Sample size n = 3
Possible samples = 10
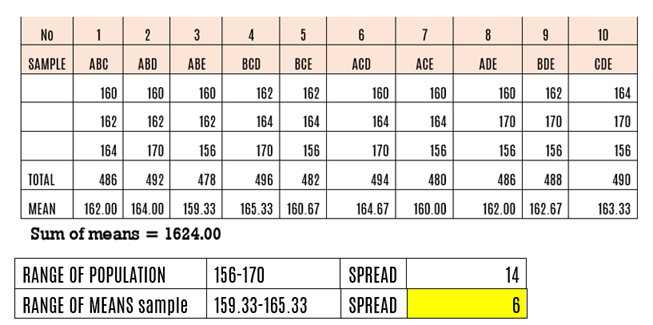
means sample range is less than the population range Average of 10 means = (162+164+159.33+165.33+160.67+164.67+160+162+162.67+163.33)/10= 162.40; Average of means is exactly equal to population mean
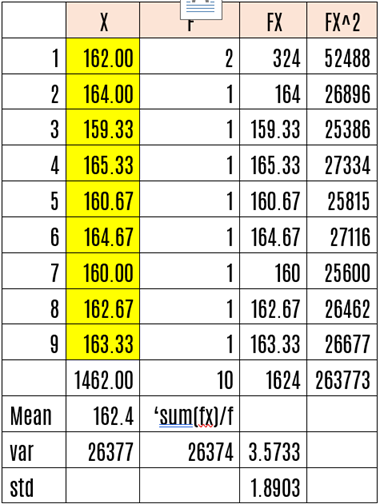
Variance of samples: =FX^2/f – 162.4^2
= 26377 – 26374 = 3.5733
Std of samples = sqrt(3.5733) = 1.8903
Standard deviation /standard error of sampling means
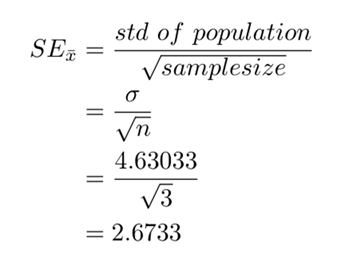
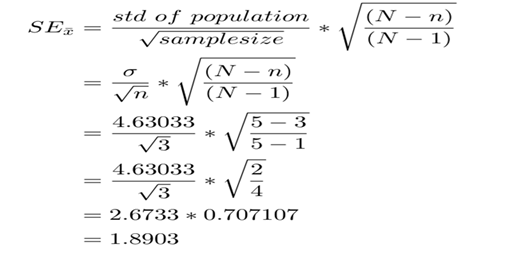
This is not tallying with actual calculation of standard deviation of sampling distribution means (1.8903). Here multiplying factor as we come across finite population. In our example we have
Population size N= 5
Sample size n = 3
When we deal with finite population the standard error/standard deviation of sample will be equal to
Now both the standard deviation of population and the standard deviation of sampling means are equal. There is a huge difference
The reason for the difference is due to the following assumption
- infinite population, OR
- sampling with replacement, OR
- population much larger than sample size.
Simple Random Sampling Without Replacement
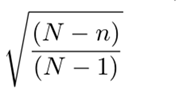
we are sampling more than half the population. To equalize you have to use the formula
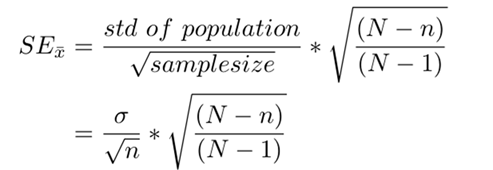
Once one value is selected, it cannot appear again, so observations become dependent. That reduces variability. Finite population correction is also called multiplying factor for arriving at the correct Standard deviation of sample means when we know only the standard deviation of population (sigma) ,sample size(n) and population size(N)
When you choose samples without replacement from a tiny population:
- choosing one large value reduces chance of choosing another large value
- sample means become less spread out
- variability decreases.
Hence the standard error becomes smaller than the actual std of sample means
So, we multiply the finite population correction factor with

to find out SE of sampling means distribution
Calculation of Interval Estimate with 95% confidential level
Let us consider a finite population of 5 boys (A, B, C,D, E) whose weights are expressed in kgs. The mean of population works out to 75. If we take sample size of 3, that is if we select 3 boys in each sample, we will get samples ie., 10 samples. Sample means form a sampling distribution. You can find out the mean of sampling distribution by adding all sample means and divide by the number samples selected.

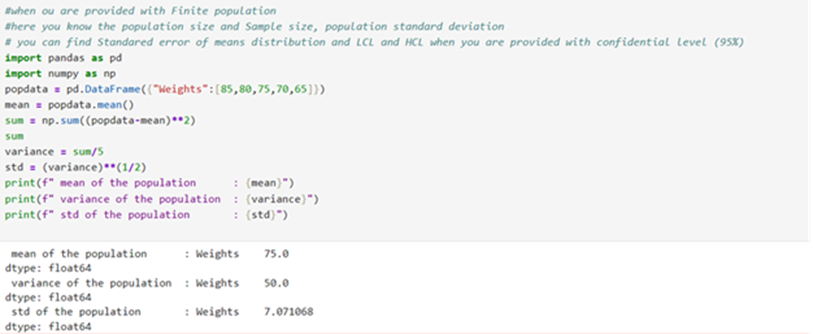
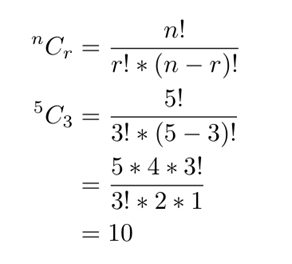
Select 3 samples outof 5 ncr = 5C3 = 10 possible samples
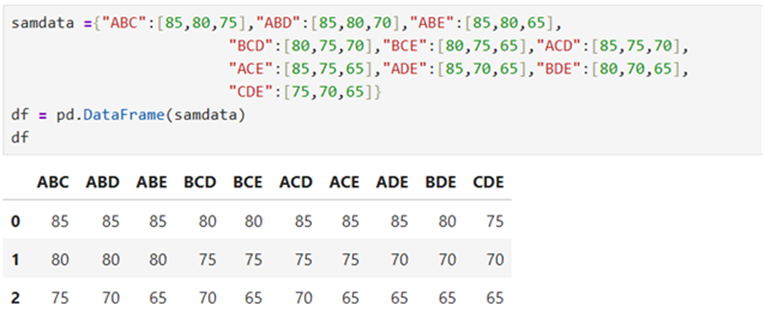
Find mean of each sample
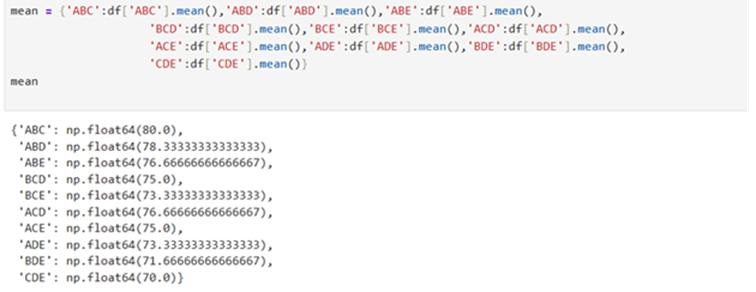
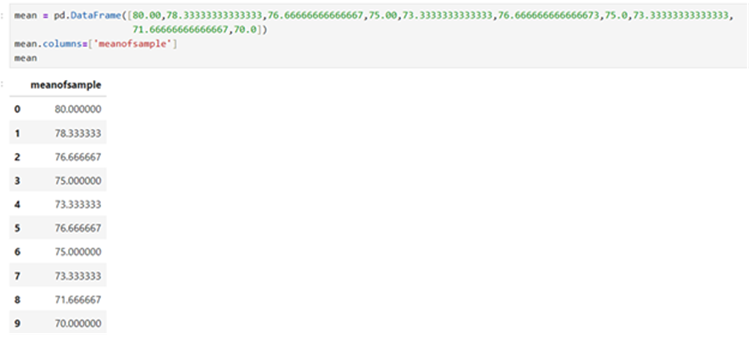
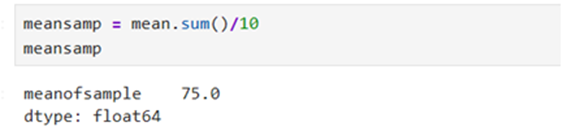
Mean of sampling distribution(means)
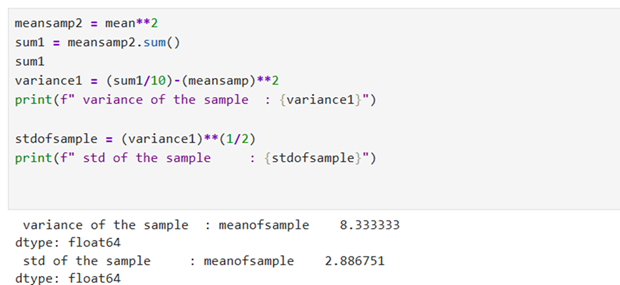
Variance and standard deviation of Sampling distribution
Find Standard Error/Std of sampling mean using formula
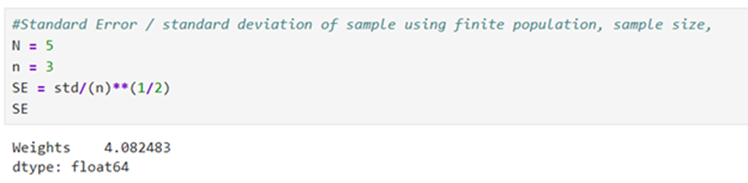
Standard Error is not equal to Standard Deviation of population. SE of Sampling mean 4.082483 <> 2.8867
As said earlier we have to use finite population correction in SE
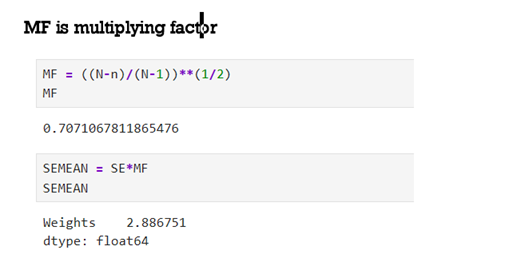
SEMEAN IS SE * MF = 2.8867
Confidence Interval and SE
Now SE of sampling mean = Standard deviation of Population
- To find Standard Error of Mean we need to know the following
- Standard Deviation of the population
- Size of the sample
- Most often we do not know the population standard deviation. So, we have to estimate standard error
- Case 1: when we know population standard deviation and
- Case 2: when we do not know population standard deviation
- For any population standard deviation, increasing the sample size (up to a point) will reduce the Standard error.
- Confidence Interval will be affected by
- a) Standard Deviation, b) Sample size and c) Level of confidence we are satisfied with
Find Interval estimate
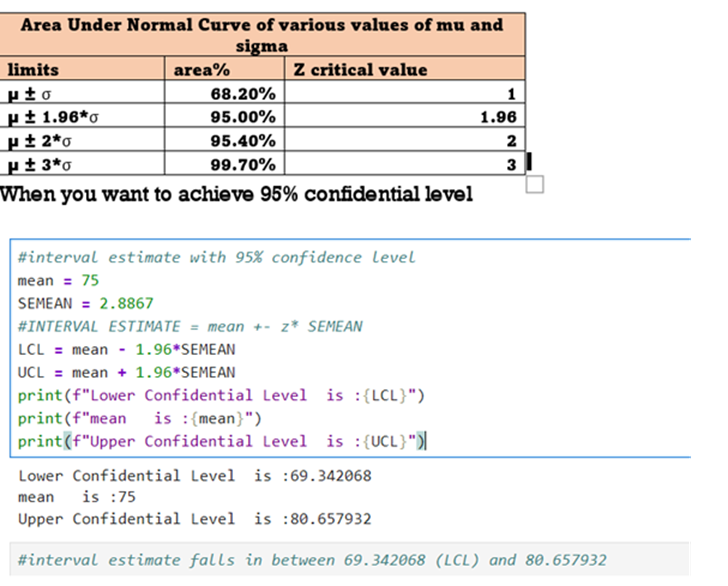
- Mean = 75
- Sample size = 3
- Confidence level required = 95% = critical value is 1.96
- Lower Confidential Level = µ-1.96 * SE(xbar)
- =75-1.96*2.8867 = 69.3420
- Upper confidential Level = µ +1.96*SE(xbar)
- = 75+1.96*2.8867=80.6579
Interval Estimates of the proportion from large samples:
- We can also estimate a proportion of occurrence in a population using sample proportion statistic.
- Binomial distribution is a distribution of discrete variables
- Mean under binomial distribution = n ∗ p
- Standard Deviation = √ n ∗ p ∗ q
- Where n is number of trials
- p is probability of success
- q is probability of failure (1-p)
- Computation using binomial distribution is tedious.
- Proportion of success = n*p/n = p
- Mean sampling distribution of proportion µ*p̂ =p
- Standard deviation of sample proportion σp̅ = √ p̂ ∗q̂ /n
- Problem:
- Sample employees 75
- Proportion of employees who is interested in self PF plans is p = 0.4
- Proportion of employees who is not interested in self PF plans is
- q = 1-0.4=0.6. Now we have to estimate the proportion parameters of entire employees using interval estimates
Solution:
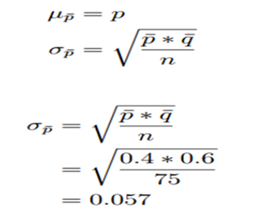
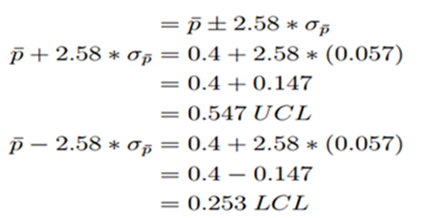
- Estimate standard error of the proportion is 0.057.
- A 99% confidence would include 49.5% of the area on either side of the mean in sampling distribution.
- From the probability table you can find out the z value.
- To cover 0.4951 area on both sides z value could be 2.58.
- To get 99% confidence the interval estimate must lie in between mean plus or minus 2.58 times of standard error