
When random variable X is discrete, we were using Bernoulle, Binomial, Poisson distribution. When random variable X is continuous like height, weight, it is not possible for us to distribute the total probability among different mass points as we get an infinite number of values between two points. Here the continuous random variable is defined in terms of probability density function (pdf) f(x). f(x) satisfies the following condition
F(x) ≥ 0 for x Є (-∞,∞) and 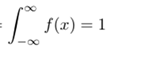
Most widely used Continuous probability distribution is known as Normal Distribution. It is also called as Gaussian Distribution. Many mathematicians like De-Moivre, Laplace, and Karl Gauss worked on this normal distribution. Since Karl Gauss derived the normal distribution, this distribution got the name as Gaussian Distribution. A continuous random variable x is defined to follow normal distribution with parameters µ andσ2, to be denoted by
X ~N(µ,σ 2)
The probability density function is given by
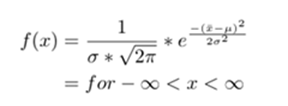
- Where µ and σ are constants and σ > 0
- Where π = 3.14 and e = 2.7183, E(X) = µ, VAR(X) = σ2
- STD(X) = SQRT(VAR(x))
Probability density function (PDF) for a normal distribution is a bell-shaped curve, also known as a Gaussian curve
- The peak of the curve represents the mean, and the spread of the curve reflects the standard deviation. The area under the curve represents the probability of the random variable falling within a specific range.
- Probabilities are calculated using the area under curve over an interval
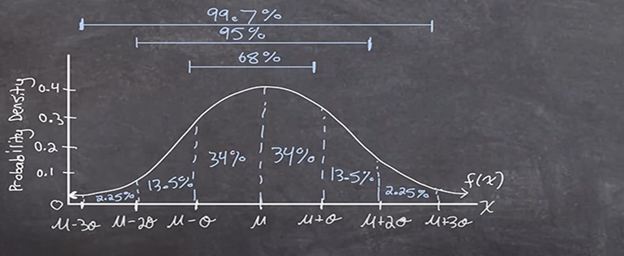
- Mu and sigma are the parameters(µ,σ )
- It is bell-shaped curve and it is symmetric about its mean
- It is symmetrical (non-skewed)
- The mean, median and mode are equal
- The mean divides the curve into two equal parts
- The quartile deviation QD= 2/3 *σ=0.675σ
- The first quartile deviation QD1= µ- 0.675σ
- The third quartile deviation QD3 = µ+0.675σ
- The mean deviation MD = 4/5*σ=0.8σ
- The X-axis is asymptote to the curve asymptote is a straight line that touches the curve at infinity
- It is a unimodal
- The mean, median and mode coincide
- The normal distribution is symmetrical about x = µ . As such, its skewness is zero i.e. the normal curve is neither inclined move towards the right (negatively skewed) nor towards the left (positively skewed).
- The normal curve y = f (x) has two points of inflexion to be given by x = µ–σ and x = µ + σ i.e. at these two points, the normal curve changes its curvature from concave to convex and from convex to concave.
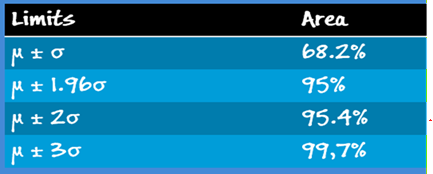
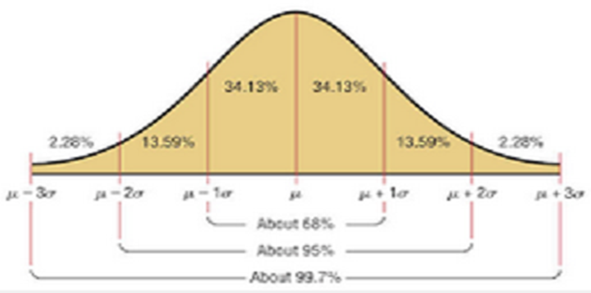
- The area under normal curve within certain limits is shown in following table.

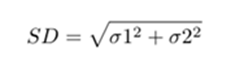
18. If x and y are independent normal variables with means and standard deviations µ1 and µ2, σ1 and σ2, then z = x+y follows normal distribution with mean (µ1+µ2) and
19.Normal Distribution is the limiting form of Binomial Distribution.
Standard Normal Variate:
Normal Variate with mean µ = 0 and standard deviation σ = 1 is called standard normal variate.
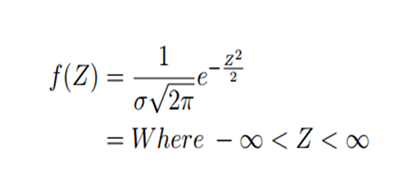
It is denoted by z. The probability density function (p.d.f) is given by
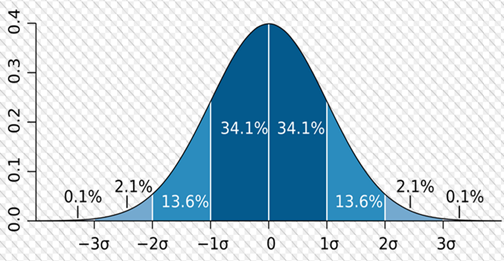
STANDADRD NORMAL DISTRIBUTION: WHERE µ=0 and σ = 1,2,3
Conversion of Normal distribution to Standard Normal Distribution
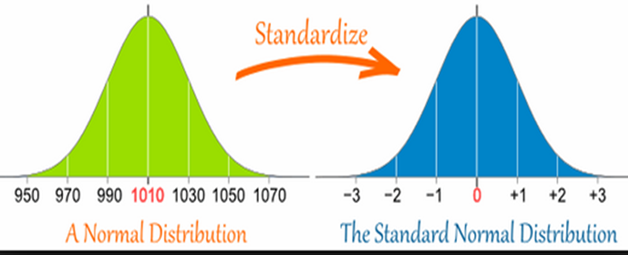
Standard Normal Distribution Characteristics
- Area can be read from the table of areas under standard normal curve
- Let X be a normal variate with mean µ and standard deviation σ
- Then Z is a standard normal variate
- Standard Normal Variate is denoted by N(0,1)
- Statisticians have developed Standard Normal Table Values
- Any normal distribution can be converted to a Standard Normal distribution
- Z varies from -∞ to +∞
- The mean of standard normal distribution Is 0 and SD is 1
Shaded area – Variate takes any value from 0 to Z
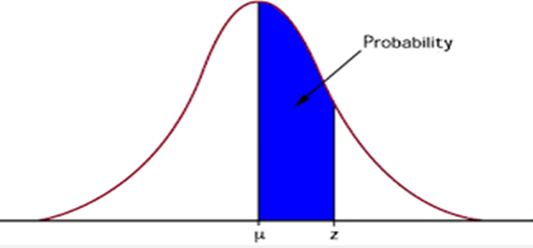
Area:
- The probability that variable is between -0.96 and 0
- Refer to table you will get as 0.3115
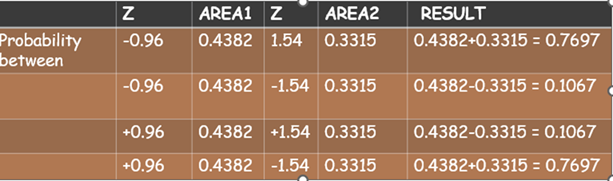
Rules:
- If Z values have the same sign (Plus or minus) subtract smaller value from bigger value obtained from table
- If Z values have opposite sign Add values obtained from table.
Calculation of Probability:
Problem 1: Say distribution has a mean Rs.19000 and a standard deviation of Rs.2000. We draw a sample of 30 staff members. What is the probability that their earnings will average more than Rs.19750 annually. Area representing earns over Rs.19750
Population standard deviation: 2000, size of sample = 30
Step 1 : find standard deviation of the sample and Z value
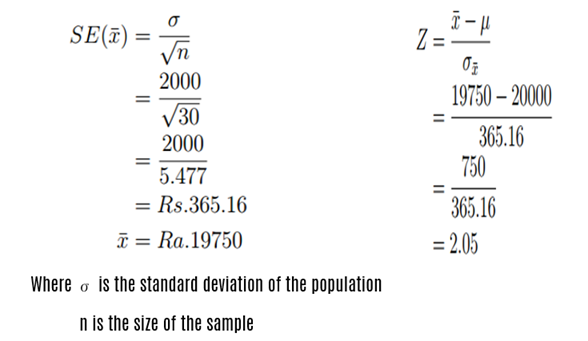
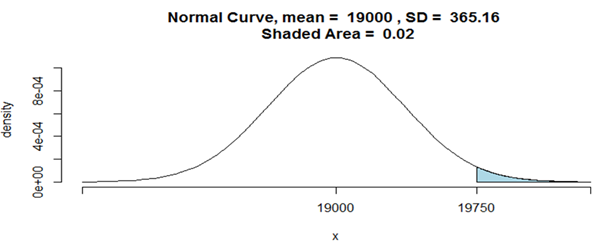
Calculation of Area representing earnings over Rs.19750
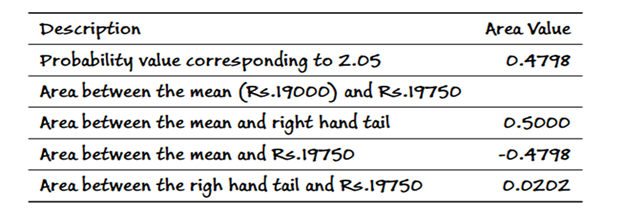
apply rule :
- If Z values have the same sign (Plus or minus) subtract smaller value from bigger value obtained from table
Slightly more than 2% chance of average earnings being more than Rs.19750 annually in a group of 30 staff members.
Problem 2: A bank Calculates that its individual savings bank accounts are normally distributed with a mean of Rs.2000 and a population standard deviation of Rs.600. The bank takes a random sample of 100 accounts.
What is the probability that the sample mean will lie in between Rs. 1900 and Rs.2050?
Step 1: Find out the Standard Error of the Mean :
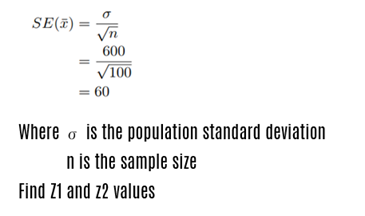
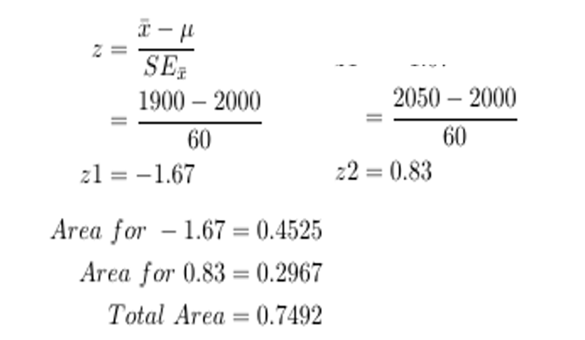
z1 is negative and z2 is positive. Apply Rule 2:
If Z values have opposite sign Add values obtained from table.
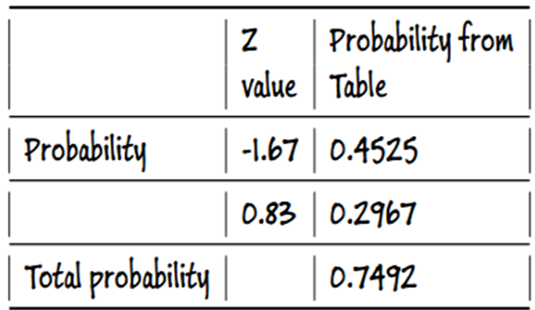
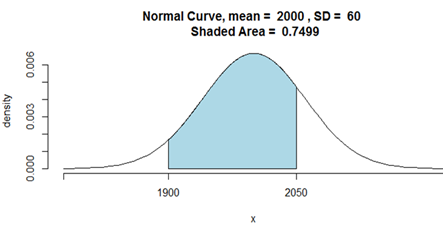
Conclusion:
75% of the sample mean will lie in between Rs. 1900 and Rs.2050?
Problem 3:
The weight of Halwa packed by the filling machine follows a normal distribution with mean weight of 500 gm and standard deviation of 10 gm. A pack is selected at random. What is the probability that
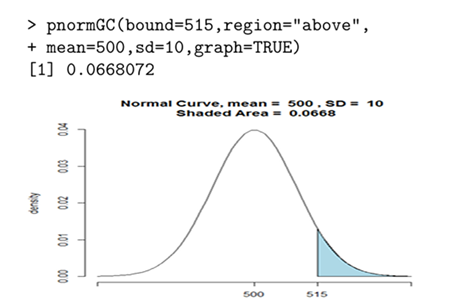
(a) The pack’s weight will exceed 515 gm?
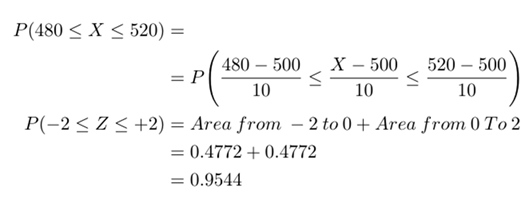
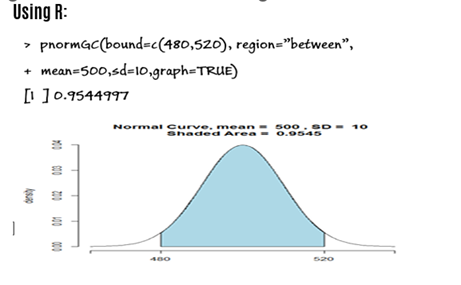
(b) The pack’s weight lies within 480 and 520 gm?
(c) The proportion of packs will have less than 480 and greater than 520 gm
if 10000 packs are supplied how many packs will be rejected given that 480 gm and 520 gm are lower and upper limit for acceptance?
Solution: X is normal variate with parameters mean= 500 and standard deviation =10.Therefore
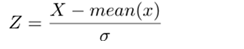
is standard normal variate.
a) Probability that the pack’s weight will exceed 515 gm is given by
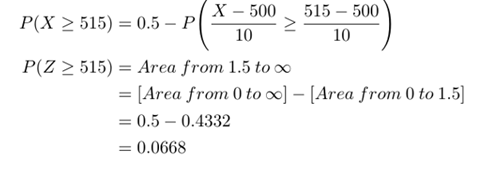
b)What is the probability that the pack’s weight lies within 480 and 520 gm
(c) The proportion of packs will have less than 480 and greater than 520 gm
If the weight lies outside these values, then it will be rejected.
The probability of rejection = 1- 0.9544=0.0456
The number of packets that will be rejected is given by N*P
N*P = 10000*0.0456 = 456
Problem:4:
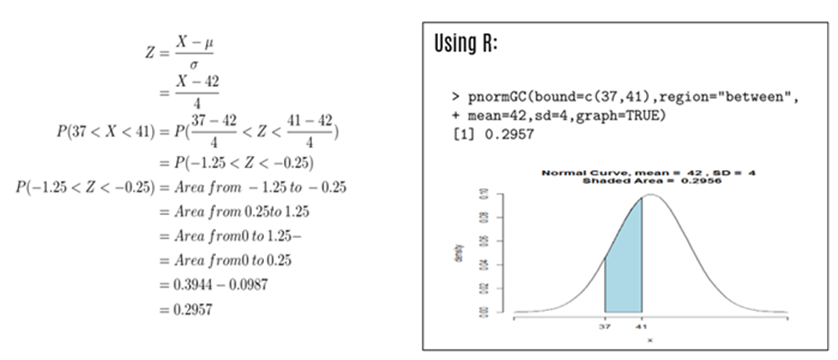
X is normal variate with mean 42 and standard deviation 4. Find the probability that a value taken by X is
(a) less than 50
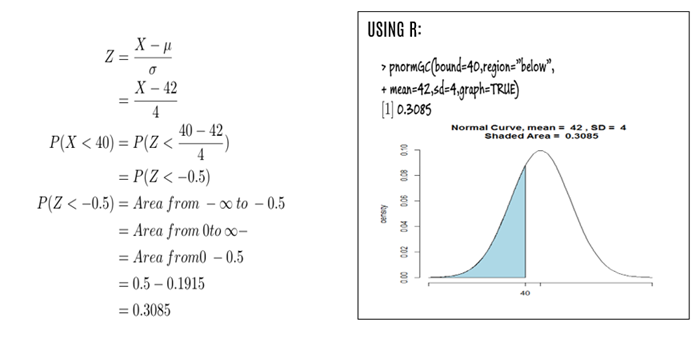
(b) less than 40
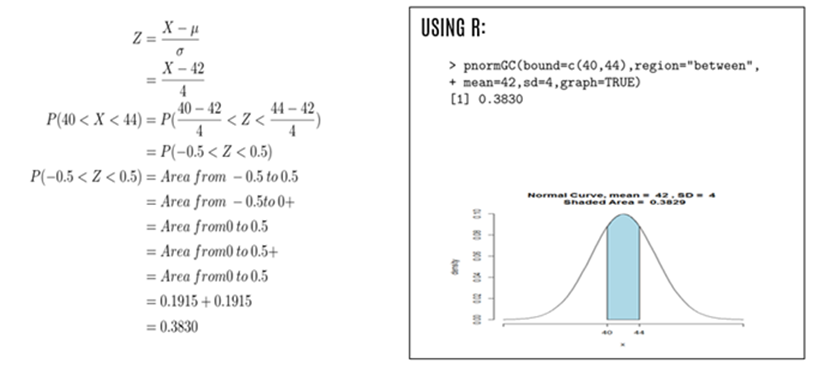
(c) between 40 and 44
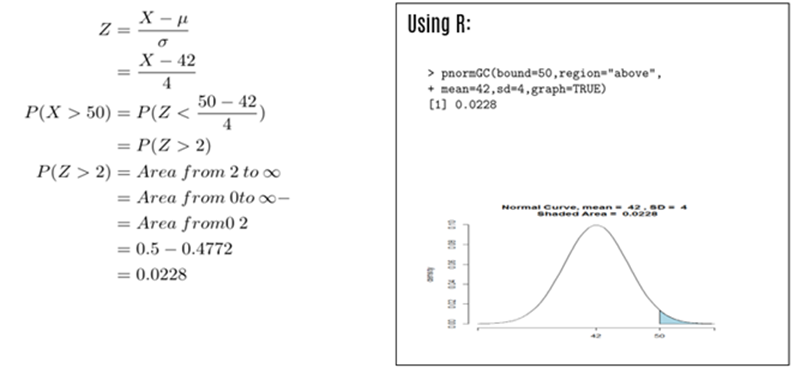
(d) greater than 50
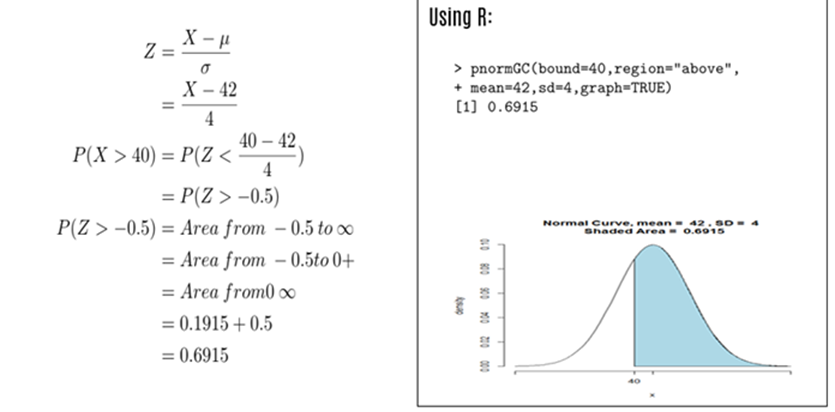
(e) greater than 40
(f) between 37 and 41
Solution:
(a) less than 50
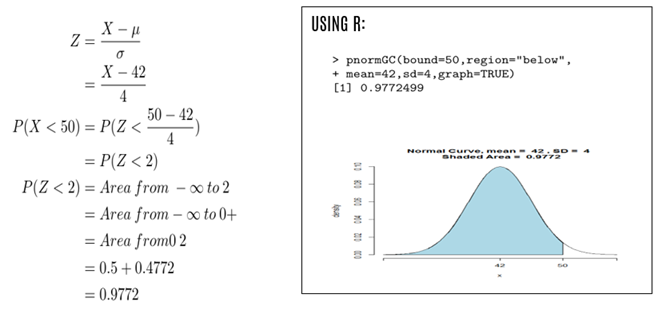
(b) less than 40
(c) between 40 and 44
(d) greater than 50
(e) greater than 40
(f) between 37 and 41
Determination of Sample Size:
Sample size depends upon
(a) the size of the population
(b) the resources available
(c) the degree of accuracy desired
(d) homogeneity of the population
(e) nature of study
(f) methods of sampling used
(g) the nature of respondents
Concerned with Population Proportions
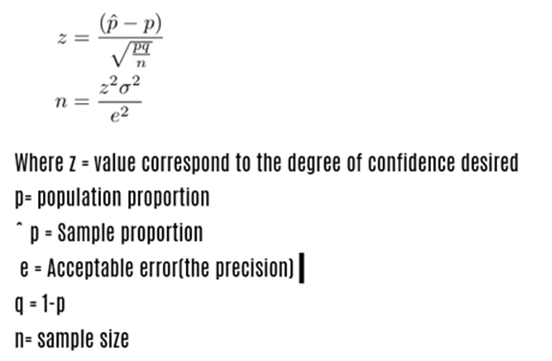
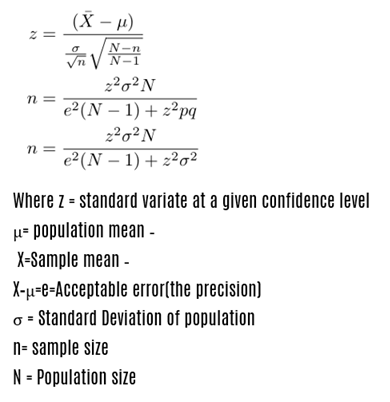
a:Based on infinite population
The formula used for calculating sample size when we like to estimate Population Proportion based on infinite population
b:Based on Finite population
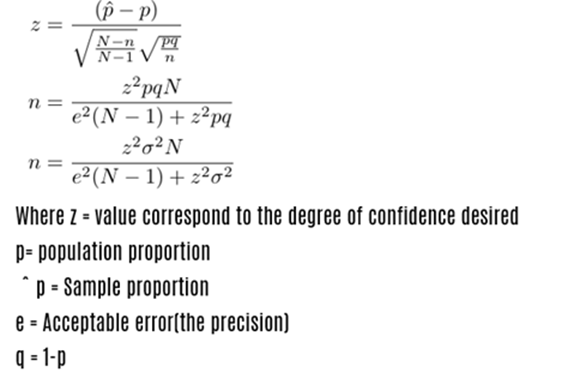
n= sample size
N = Population size
Concerned with Population Mean:
a:Based on infinite population:
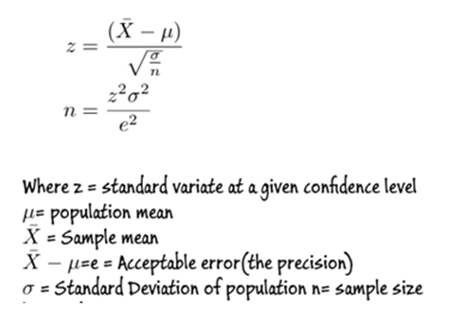
B: Based on finite population:
Problem5:
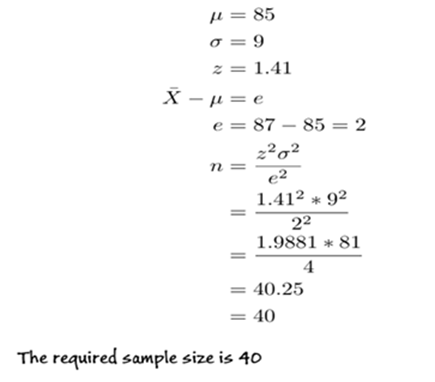
The mean expenditure per customer at a tyre store is Rs.85 with a standard deviation of Rs.9.00. If the mean expenditure of the sample is Rs.87. What is the required sample size? (Z value=1.41)
Problem6:
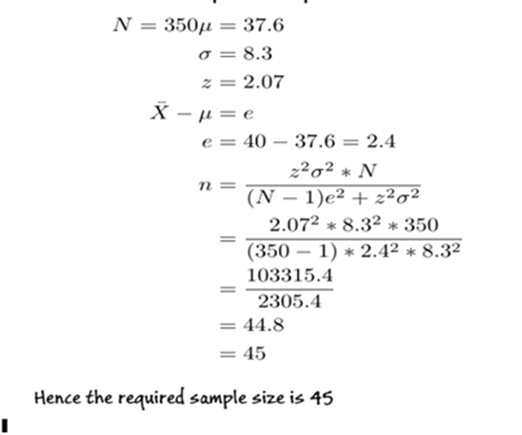
A production company has 350 hourly employees having average 37.6 years of age with a standard deviation of 8.3. If the sample average is 40 years of age and z-value is 2.07. Calculate the required sample size. Solution:
Applications of normal distribution:
- Most of the continuous variables like height, weight, wage, profit etc. follow normal distribution.
- If the variable under study does not follow normal distribution, a simple transformation of the variable, in many a case, would lead to the normal distribution of the changed variable.
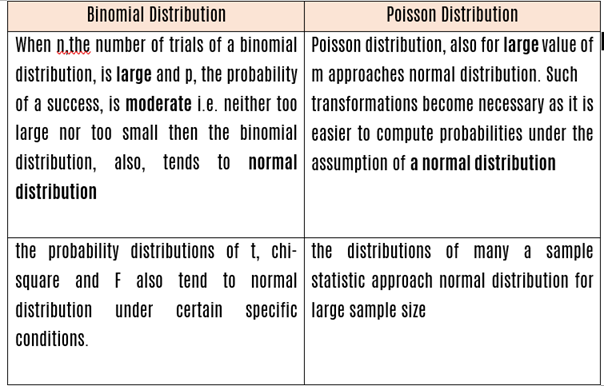
- When the following distributions approach to normal distribution
Problem 3: If the two quartiles of a normal distribution are 47.30 (QD1) and 52.70 (QD3) respectively. what is the mode of the distribution? Also find the mean deviation about median of this distribution?
SOLUTION:
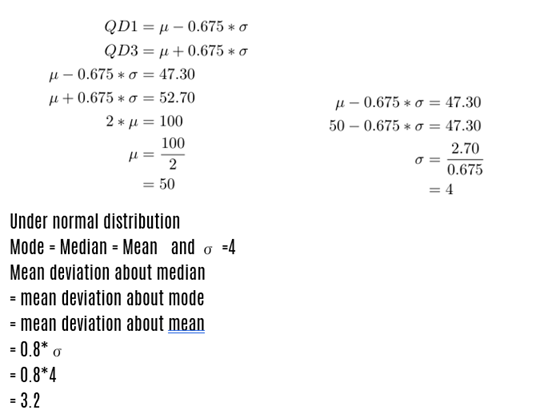
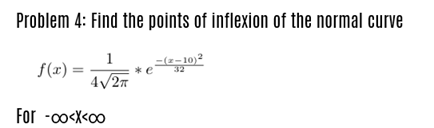
Solution:
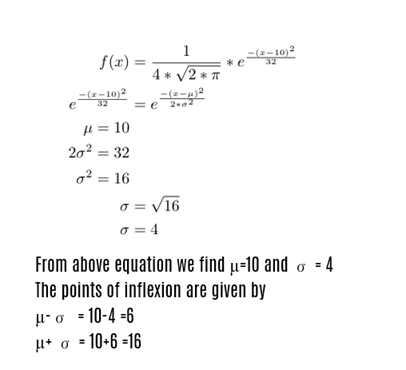
Important points:
- theoretical probability distribution exists in theory
- probability distribution may be Discrete or Continuous
- Important discrete probability distributions are Binomial, Poisson
- Important continuous probability distribution is normal distribution(bell-shaped0
- Parameters are the characteristics of Population
- Statistics are the characteristics of Sample
- A trial is an attempt to produce an outcome which is neither certain nor impossible
- Bernoulli trial is associated with just two possible outcomes(yes or no) and each trial is independent
- Probability Mass Function of Binomial Distributions(pmf) is given by
- if x is a binomial variable with parameters n and p,then x can assume any whole number between 0 and n both inclusive
- A Binomial distribution is symmetrical when p=0.5
- The mean of a Binomial distribution with parameters n and p is np
- The variance of a Binomial distribution with parameters n and p is npq or np(1-p)
- for a binomial distribution mean and mode are equal when q=0.5
- The maximum value of the variance of a binomial distribution is known as n/4
- Poisson is uni-parametric distribution
- For a Poisson distribution mean and variance are equal
- Poisson distribution may be unimodal or bimodal
- Poisson distribution is always positively skewed
- A Binomial distribution with parameters n and p can be approximated by a Poisson distribution with parameter m = np when n tends to infinity and p tends to 0 so that np remains finite
- For fitting to an observed frequency distribution, we equate the Poisson parameter to the mean of the frequency distribution
- The Probability Density Function(pdf) of a normal variable x is given by
- The total area of the normal curve is 1
- The normal curve is Bell-shaped and symmetrical
- Area of the normal curve lies -∞ to µ and µ to ∞ (0.5+0.5 =1)
- The mean=median=mode will always be equal under normal distribution
- For standard normal distribution the points of inflexion are given by
- The symbol θ (a) indicates the area of the standard normal curve between -∞ and a
- The interval (µ-3σ ; μ + 3σ ) covers 99% area of normal distribution
- Number of misprints per page of a thick book follows Poisson distribution
- The wages of workers of a factory follows Normal distribution
- If X and Y are two independent normal random variables then the distribution of (X + Y ) is normal