We studied about the estimation of population parameter from the sample statistics in the previous chapter point estimate and interval estimate. We also studied about how point and interval estimates behaved at different confidential interval such as 95% and 99.7%. Also noted how the population parameter lies in between mean ± z*SE of means distribution. Now it becomes necessary to test if our estimation of population parameter is to be accepted or rejected based on hypothesis testing. Hypothesis testing enables you to take decision about credibility/accuracy of the estimated population parameter.
- We assume certain value to the population parameter.
- To Test the validity of our assumption we collect samples from the population and find sample statistics
- Now we find the difference between the assumed value of population parameter and the actual value of sample statistic.
- Now we judge whether the difference is significant or not.
- The smaller the difference the greater the chance of concluding the fact that the assumed value of population parameter is correct. Hypothesis can be accepted.
- Instead, we may say that there is no sufficient statistical evidence to reject our hypothesis. The large the difference the smaller the chance of accepting the assumption made. So, we reject the hypothesis we made
Activities Involved:
- Assumption of two types of hypotheses. A) Null Hypothesis (H0) and B) Alternative Hypothesis (H1)
- Applying different types of test statistics.
- Identification of test for a given problem.
- Identification of type of errors we encounter
What is Hypothesis?
Nothing but an assumption.
Example: Sterlite Copper’s Industrial Unit of Tuticorin is reported to have dumped copper slag in the river. Because of that the ground water has been polluted and contaminated. People started protesting against the pollution that the unit caused. people in that area started feeling ill.
Assumption: People in that area are suffering from illness due to the pollution caused by that unit.
Question here is whether this is to be accepted or rejected by Pollution Control Board of India .
Activity: Small samples are to be collected and tested to prove that the hypothesis is true or wrong. Conducting Survey to get the feeling of entire Tuticorin people is impossible. So, we conduct a random sample survey. Using sample statistics, we may arrive at the conclusion whether the Hypothesis is true or wrong. Hypothesis testing is about making inference of the population parameter using sample statistics.
Types of Hypotheses:
Assumptions we make:
Example: Parameter – mean (population mu)
Null Hypothesis:
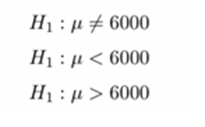
Before entering into sampling techniques, we assume the value of population parameter (Hypothesis value of parameter).Null Hypothesis is denoted by H0. Say the population mean income is Rs.6000. H0: µ=6000
Alternative Hypothesis:
- If Null Hypothesis is not true what course of action we have to do and to conclude.
- For this alternative hypothesis are to be made.
Another example: Proportion (population – p)
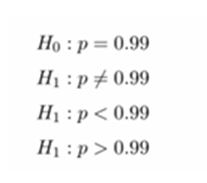
Suppose if we need to test the success rate of a particular treatment against COVID-19 we make a null hypothesis for the success rate ’p’(for the test value of 0.99 ) as
Level of Significance:
- Under Testing of Hypothesis, the level of significance plays a vital role in determining the decision whether to accept or reject Null Hypothesis.
- The question whether the difference between sample statistic and the assumed value of population parameter(mean, variance, proportion) is significant or not determines our acceptance or rejection of Null hypothesis.
- Under estimation the confidence level points out the percentage of sample statistic that falls within the confidence limits.
- Under Testing of Hypothesis, the confidence level points the percentage of sample statistic that falls out-side the confidence limits
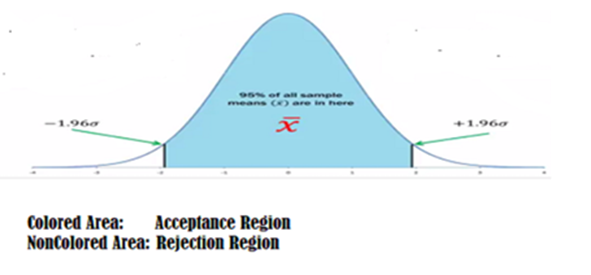
- Remember, even if the sample statistic falls within the non-shaded region, it does not prove that our Null Hypothesis is true/correct. It does not provide any statistical evidence to reject our Null Hypothesis. Instead of saying we do not reject the hypothesis we say we accept. This is the standard practice.
- Actual acceptance is impossible as we cannot find the population parameter in practice.
- The acceptance and rejection region of sample are shown below.
Selection of Significance Level:
You can have any number of selection levels. However, in practice the following two significance levels are used.
- 5% Level of Significance: Under this the possibility of rejecting Null Hypothesis is higher when Null Hypothesis is true.
- 1% Level of Significance: We will never accept the Null Hypothesis when Null Hypothesis is not true under 1% Level
Possible situations Under Testing of Hypothesis:
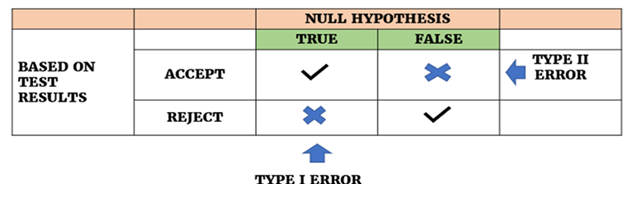
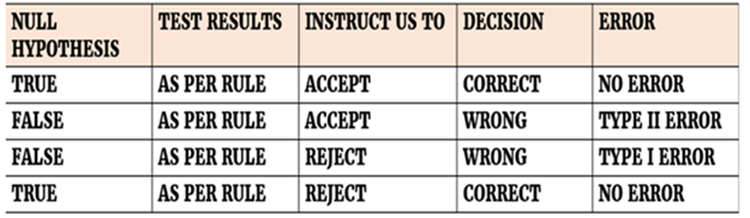
Accept on Two Conditions:
- Null Hypothesis is true and test result also recommends us to accept null hypothesis. This means we have taken a correct decision.
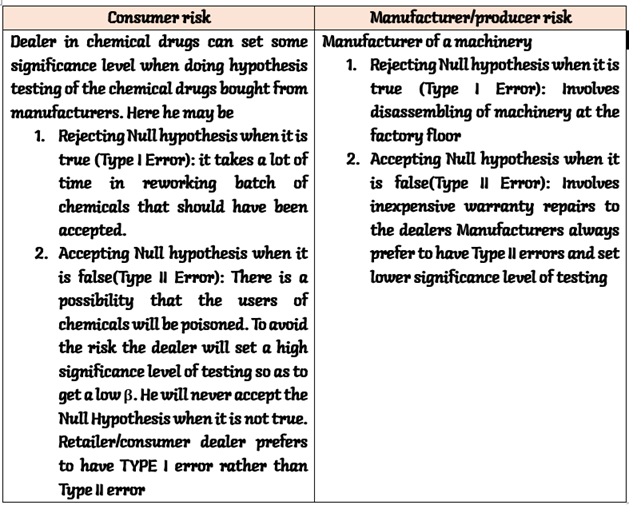
- Null hypothesis is false but test result recommends us to accept the null hypothesis. It is a wrong decision. We should have rejected Null Hypothesis. But there is no statistical evidence to reject the null. So, we accept. Here TYPE II error creeps in. This is called producers risk and it denoted by β. 1−β is called the power of the test.
Reject on Two Conditions
- Null Hypothesis is false and test result also recommends us to reject null hypothesis. This means we have taken a correct decision.
- Null hypothesis is True but test result recommends us to reject the null hypothesis. It is a wrong decision. We should have accepted the Null Hypothesis. But there is no statistical evidence to accept the null. So, we reject. Here TYPE I error creeps in. This is called consumers risk and it denoted by α
Errors that creep in:
Selection of appropriate Sampling Distribution:
We use of two types of distributions for testing purpose:
- Normal Distribution – Z-Distribution
- Students t-Distribution
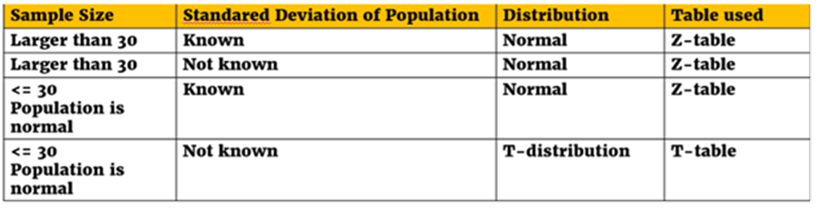
Selection is based on two factors
- a) Size of the sample
- b) Standard Deviation of Population
Rules to be applied:
Example:
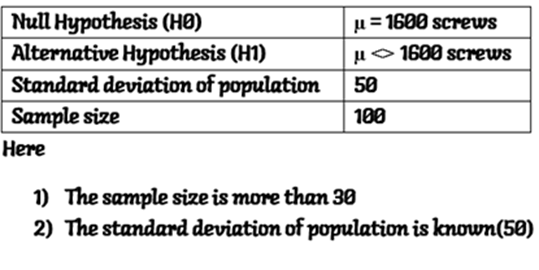
Selection of Distribution and Table for the above problem:
- Apply Normal Distribution
- use z-tables to calculate area value of sample mean
Example 2:
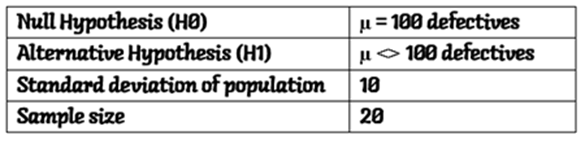
- the sample size is less than 30
- The standard deviation of population is known(10)
Selection of Distribution and tables for calculation of sample mean
- apply t-Distribution
- Use t-tables to calculate area value of sample mean
What type of distribution is to be used?
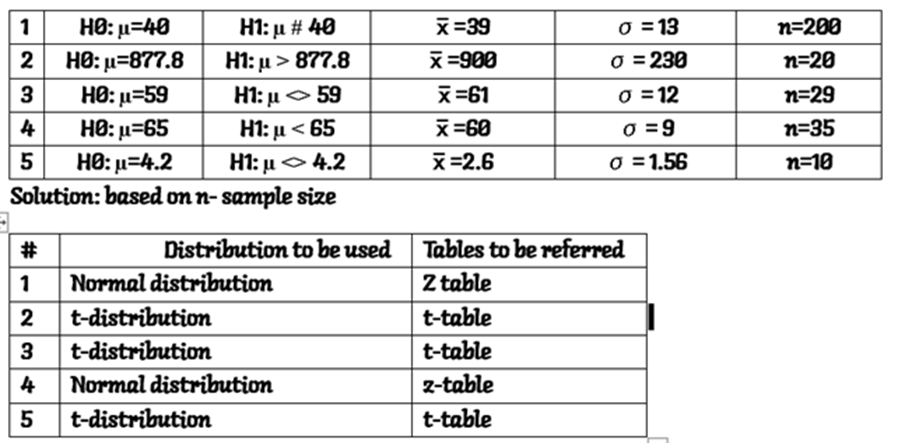
Types of tests being conducted:
We conduct two types of tests to accept or reject the null hypothesis made on the population parameter (mean or proportion) based on the samples statistics drawn from the population:
- Two-tailed test
- One-tailed Tests(Left, Right):
1.Two_tailed Test
Under two-tailed test we reject the null hypothesis when the sample mean is slightly higher or lower than the assumed/hypothesized population parameter(mean).
- The null hypothesis H0:µ=µ0 (mu0 is some assumed value of population mean)
- The alternative Hypothesis:H1:µ <>µ0
Example:
The manufacturer of tube lights wants to produce tubes with mean life of say µ=µ0=1500 hours. Before delivery he conducts a two-tailed test and finds out the mean life of his tubes. If it works out to less than 1500 his customers will not be happy and they will avoid buying his company’s tubes. If it works out to more than 1500 hours his customers will be happy. But his cost of production will go high and it will affect his profitability. So, his Null Hypothesis would be

Under the above two-tailed test the null hypothesis will be rejected if the mean value of sample is not exactly equal to the assumed value under null hypothesis. In some situations, we may not be able to use two-tailed test. In such cases we have to use one-tailed test.
2.One_tailed Test:
Under two-tailed test we reject the null hypothesis when the sample mean is slightly higher or lower than the assumed / hypothesized population parameter(mean).
- The null hypothesis H0 : µ = µ0 (mu0 is some assumed value of population mean)
- The alternative Hypothesis : H1 : µ < µ0
- The alternative Hypothesis : H1 : µ > µ0
Example:
Let us assume a wholesale dealer buys tubes from manufacturer. When he receives stocks from the manufacturer, he wants to ensure that the life of tubes what he buys must have at least 1300 hours. At each shipment he tests some lots of tubes and finds out the sample mean of the samples. He has to take decision whether the shipment is to be accepted or rejected. He will reject the shipment if he finds the sample tubes life falls below 1300 hours. If it is more, he will accept the shipment.
- The null hypothesis H0 : µ = 1300 hours
- The alternative Hypothesis : H1 : µ < 1300
- Rejection region in the one-tailed test falls in the left side (Lower Left Tail). This is called Lower Left Tailed Test.
- Conduct Right Upper-Tailed test when alternative hypothesis is defined as H1 : µ > 1300 hours. Here rejection region falls on the right edge of the normal curve
Sample statistics used for Hypothesis Testing:
- Mean
- Variance
- Proportion
- Correlation Coefficient
Right Selection of Statistics
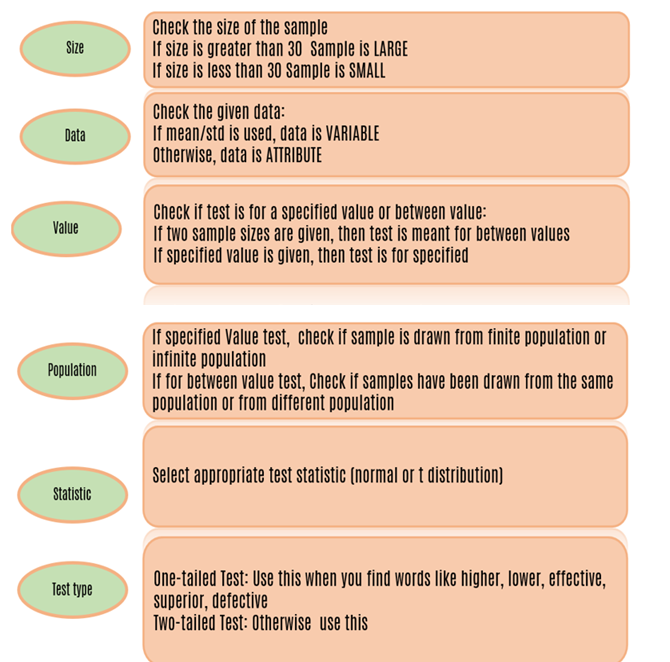
Steps involved in Hypothesis Testing:
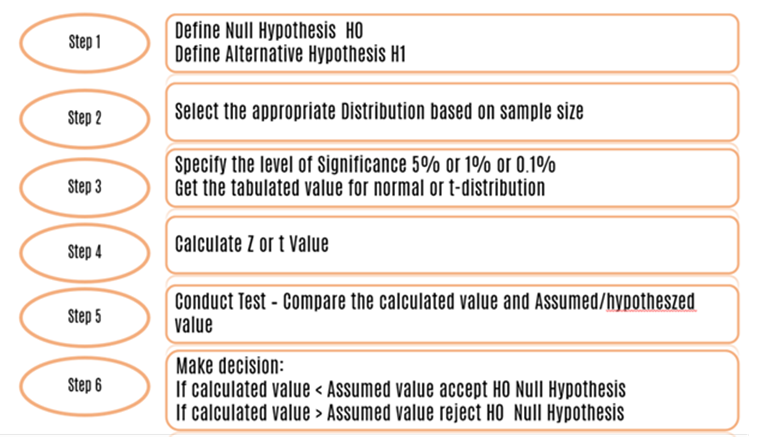
Exercise:
- 5%level of significance testing enables you to get high β
- If there is a significant difference between calculated value and hypothesized value you are accepting Null Hypothesis
- If the Null Hypothesis H0 : µ = 500,or H0 : p = p0, or H0 : µ = µ0 then you conduct one-tailed test
- If calculated value of a statistic is not in the rejection region R you are rejecting Null hypothesis
- Β is Type II error
- If n< 30 and Standard Deviation of Population is known you will find out t value
Answer;
- False
- False
- False
- False
- True
- True
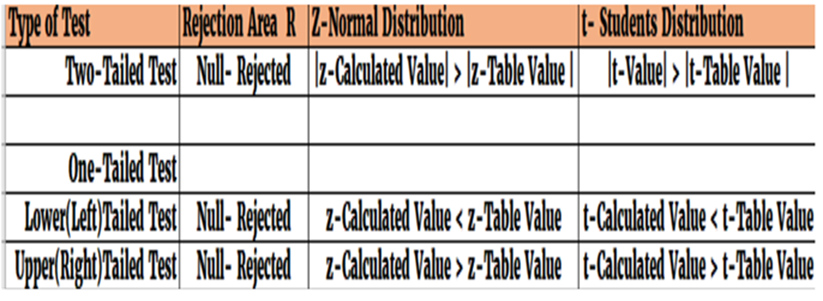
Rules for Rejection:
Using appropriate formula calculate z or t values. This is called computed or calculated value. Already we have assumed Null Hypothesis (H0) and Alternative Hypothesis (H1)
Algorithm:
If the calculated value is greater than tabulated value then
Null hypothesis is rejected and
Alternative hypothesis is accepted
Else
Null hypothesis is accepted and ( there is no evidence to reject Null hypothesis)
Alternative hypothesis is rejected.
We either accept or reject null hypothesis
The rejection region is identified for the rejection of null hypothesis. The rejection region is denoted by ‘R’.
Z value for different confidential levels (5%,1% and 0.1%)
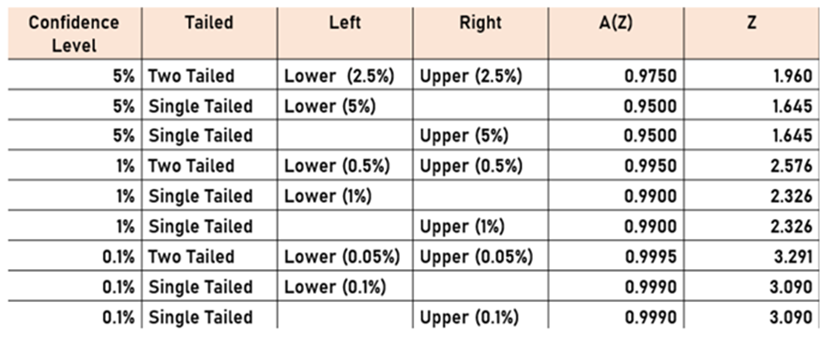
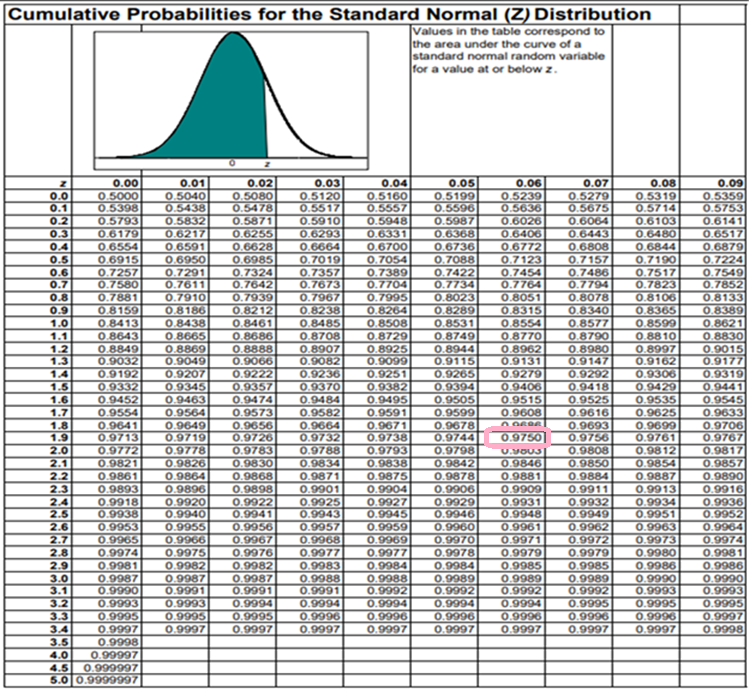
5% Two Tailed Z area 0.9750- Z-Critical value- 1.960
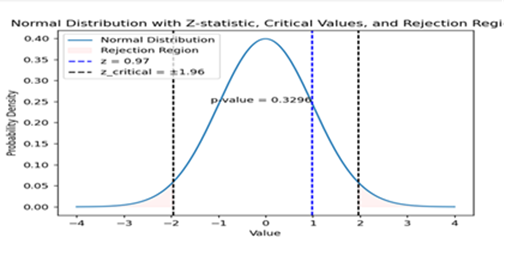
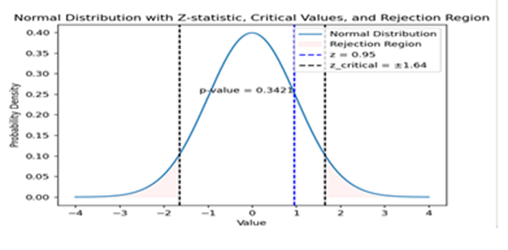
5% One-Tailed Z area 0.9500- Z-Critical value- 1.640
1% two-tailed Z area 0.99- Z-Critical value- 2.548
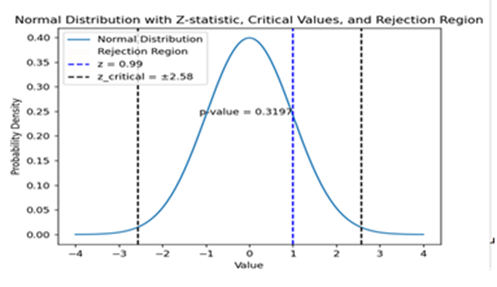
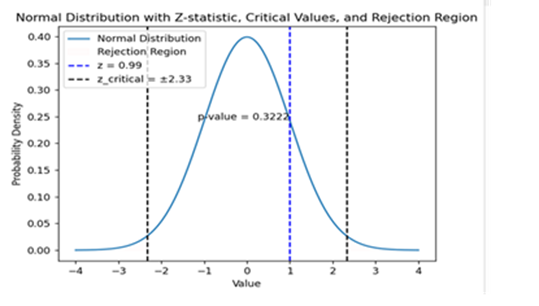
1% one tailed left or right z area =0.9900 z critical value ± 2.33