
PAIRED T-TEST: Sample size is less than or equal to 30 and Population Standard Deviation is not known
Dependent samples: Sample Size ≤ 30; σ p is not known
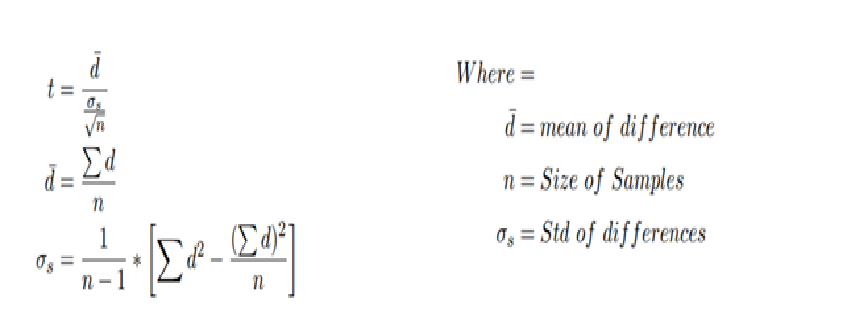
Problem:
The result of IQ test conducted for 5 students are given below. Before training and after training data are given. Test if there is any change in IQ of the students after training. t-table value at 1% significance level with 4 degrees of freedom is 4.
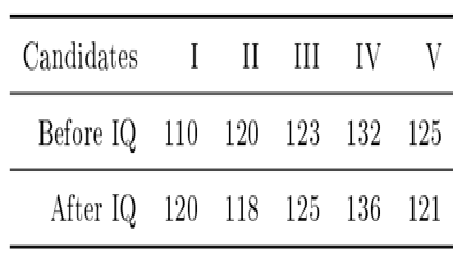
Solution:
Data relating to before training be x and Data relating to after training be y. They are independent. They are paired together. We have to apply paired t- test.
- Null Hypothesis H0 : µx = µy
- There is no significant difference before and after training
- Alternative Hypothesis H1 : µx ≠ µy
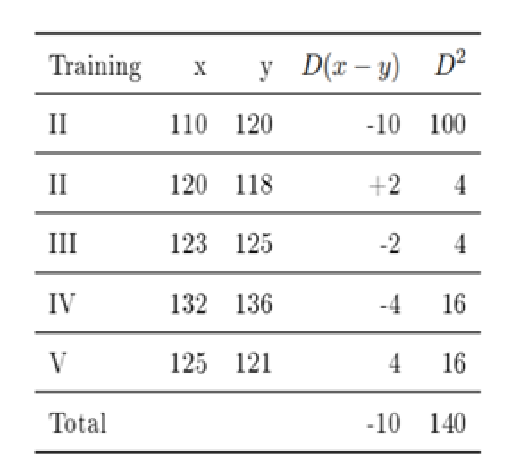
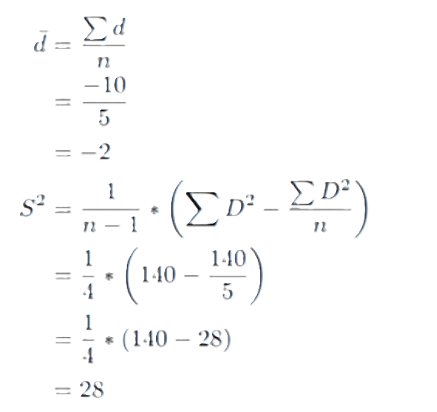
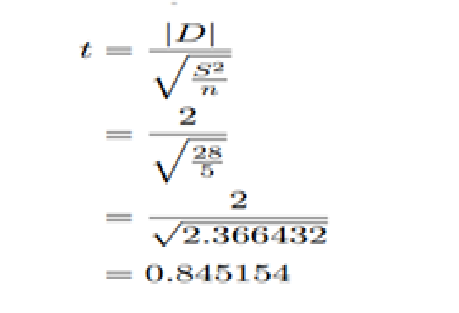
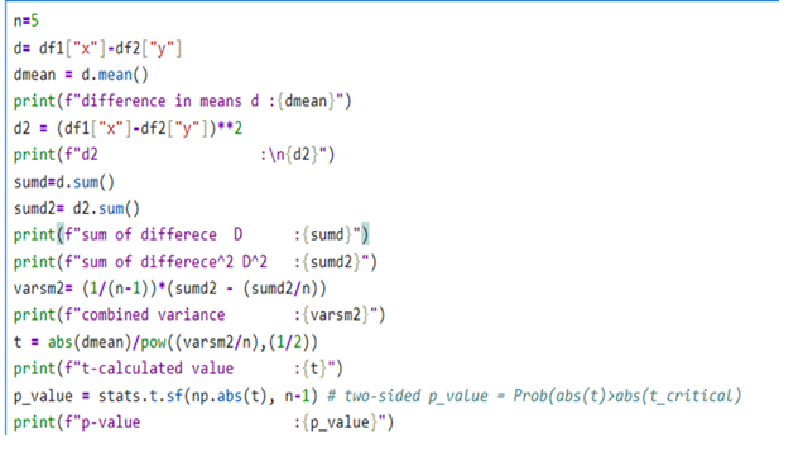
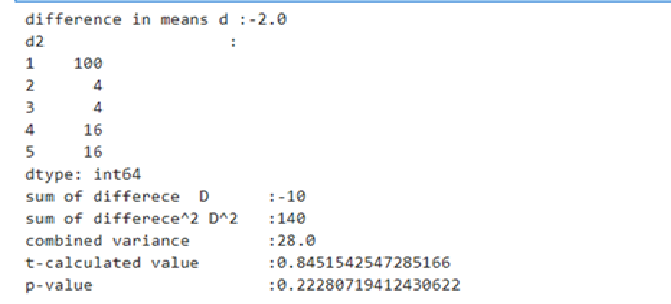
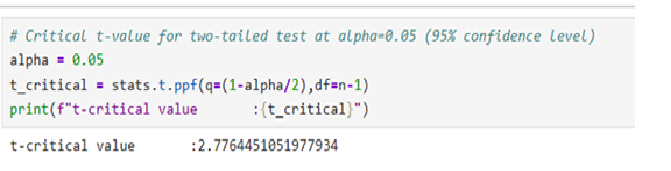
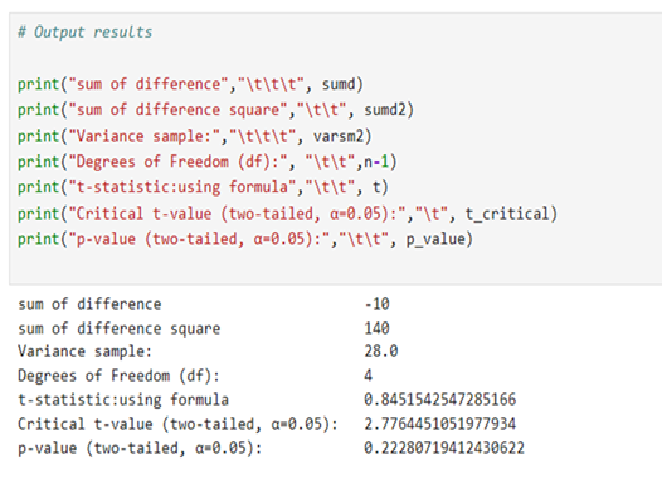
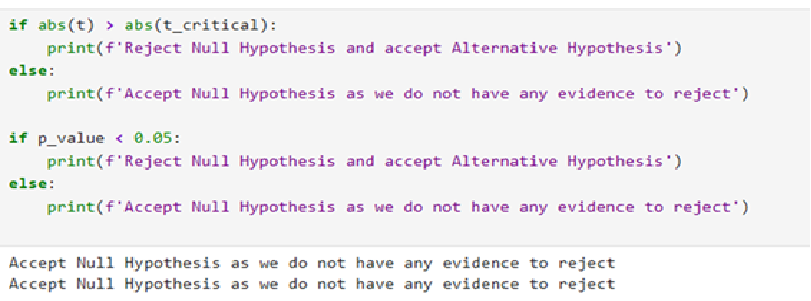
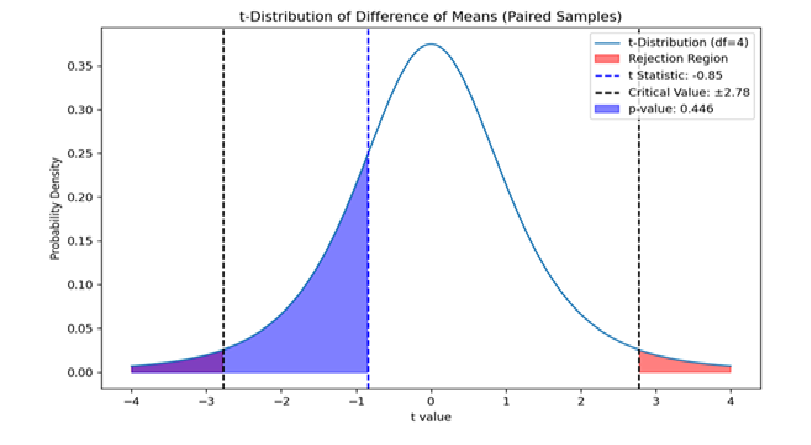
Conclusion: The calculated value (t = 0.845) is less than tabulated value (t = 2.78) and it falls outside the rejection region. We accept the Null Hypothesis. That test reveals that the means of tests are not significantly different. Both are likely to be same. There is no effect in the training. IQ of five students remains the same before and after IQ training
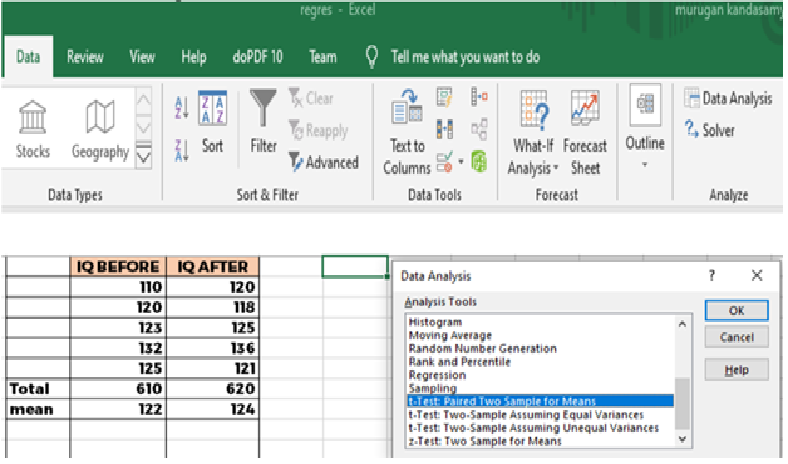
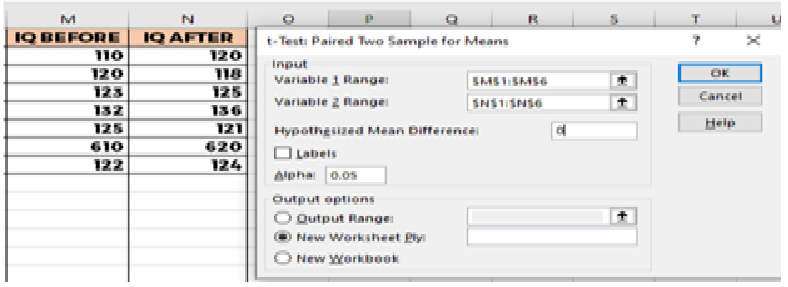
Paired t-Test Through MS Excel

Using Python: Paired-Test
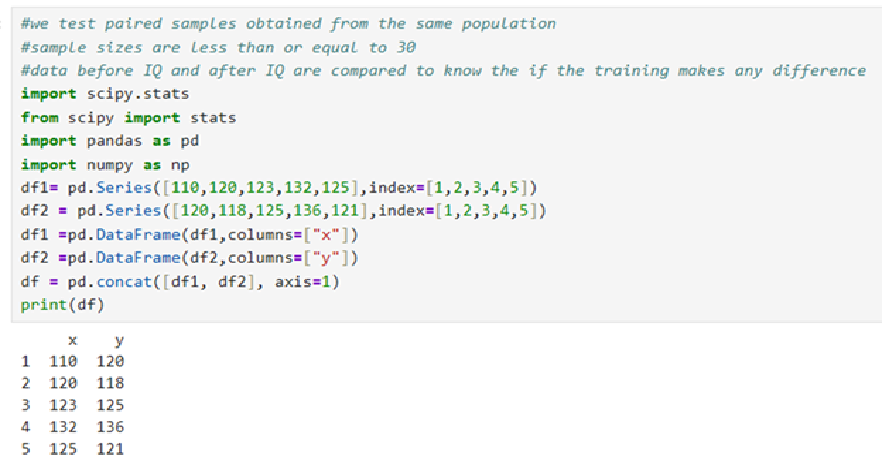
Load libraries and read data
Calculate t-value and p-value
Find t-critical value one tailed test
Display Results
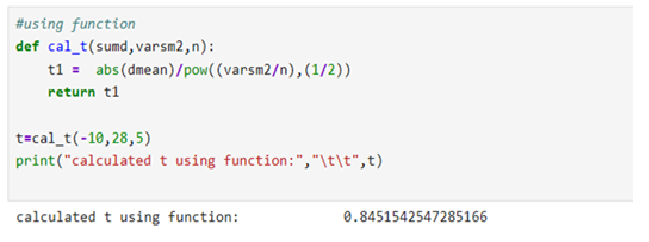
Calculate t-calculated value using function
Recommendation:
Graphical Representation:
Problem 2
Memory capacity of 10 students before training and after training are given below: Test at 5% level of significance and find if training is effective.
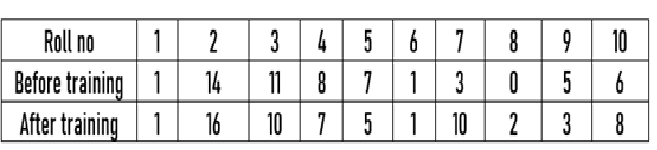
Data relating to before training be x and Data relating to after training be y. They are independent. They are paired together. We have to apply paired t- test.
- Null Hypothesis H0 : µx = µy
- There is no significant difference before and after training
- Alternative Hypothesis H1 : µx ≠ µy
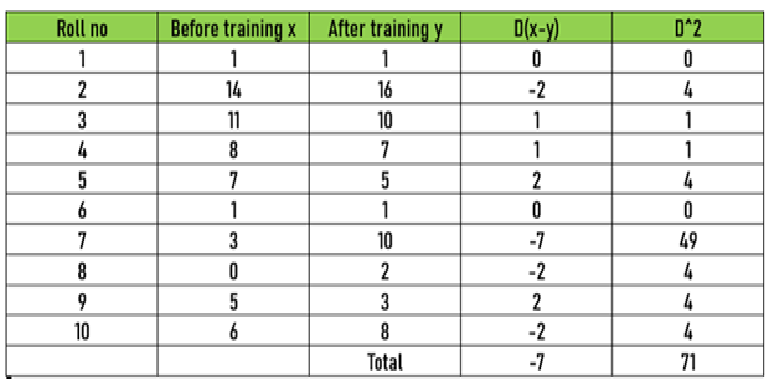
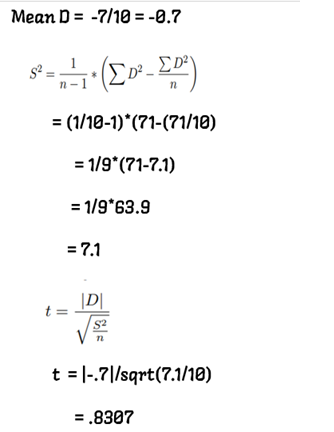
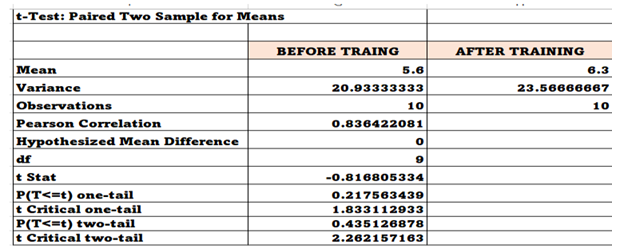
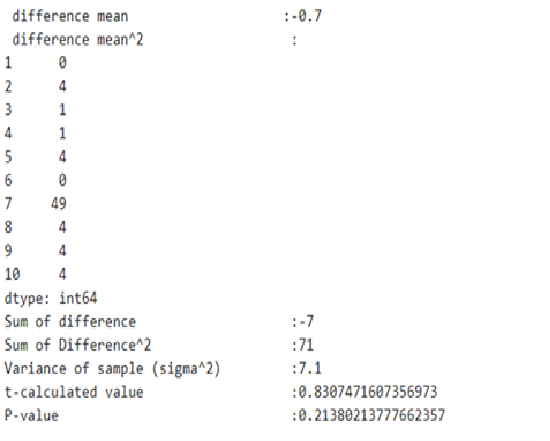
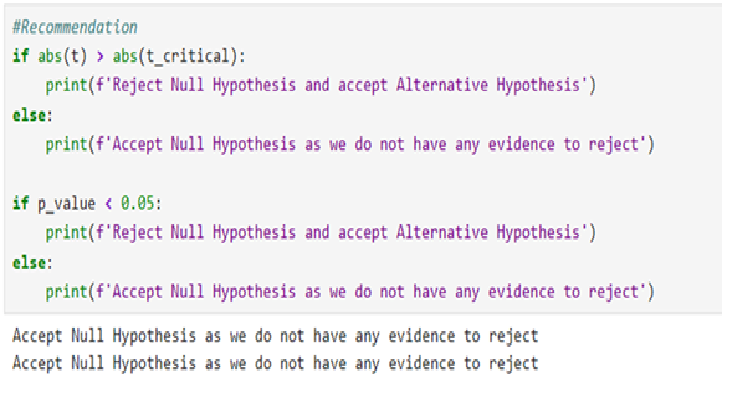
Abs(t)-0.8307 is less than t -critical value 2.2621 accept the null hypothesis and confirm that there is no difference between the means before and after training.
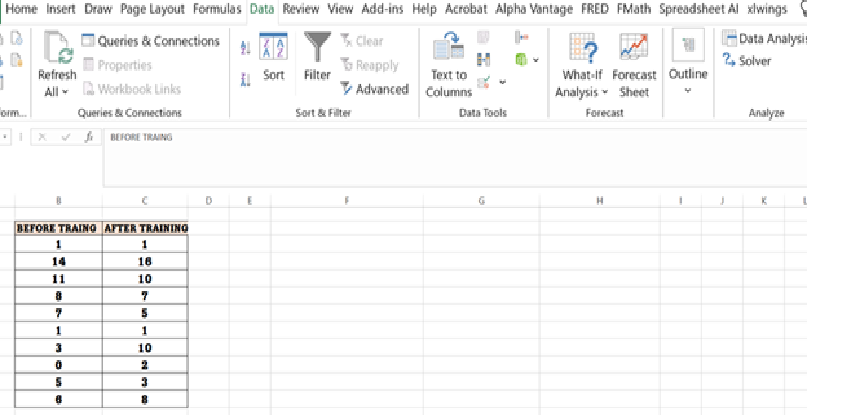
Using Excel:
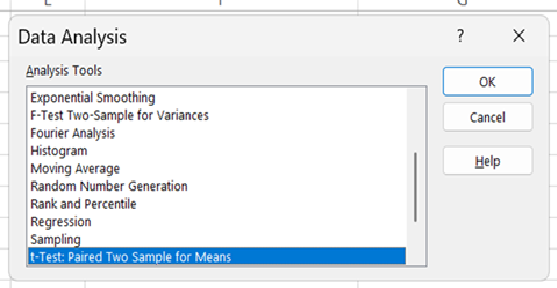
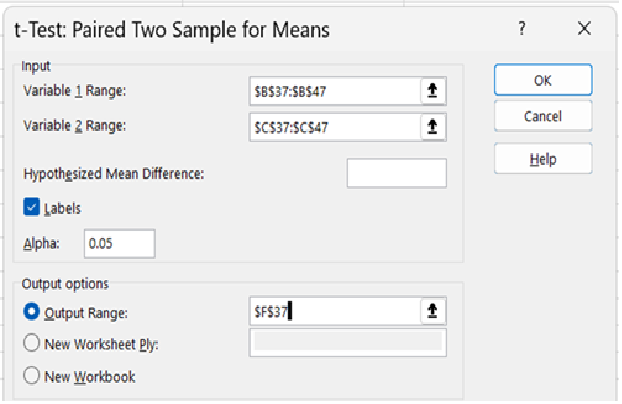
Using Python:
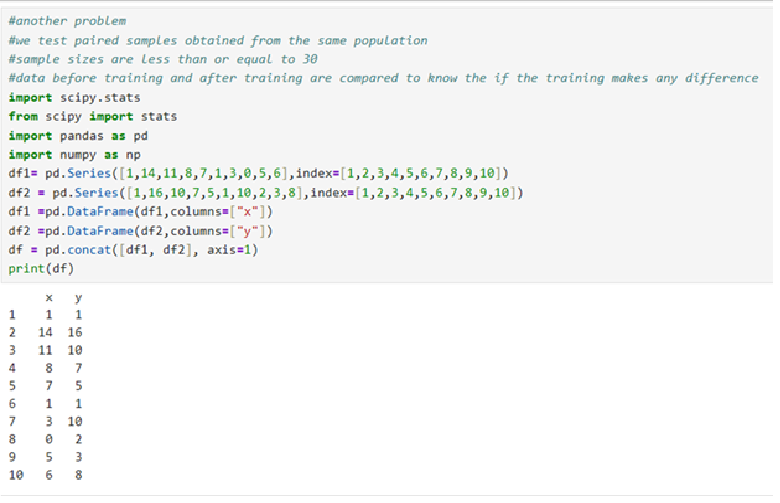
Calculate required values
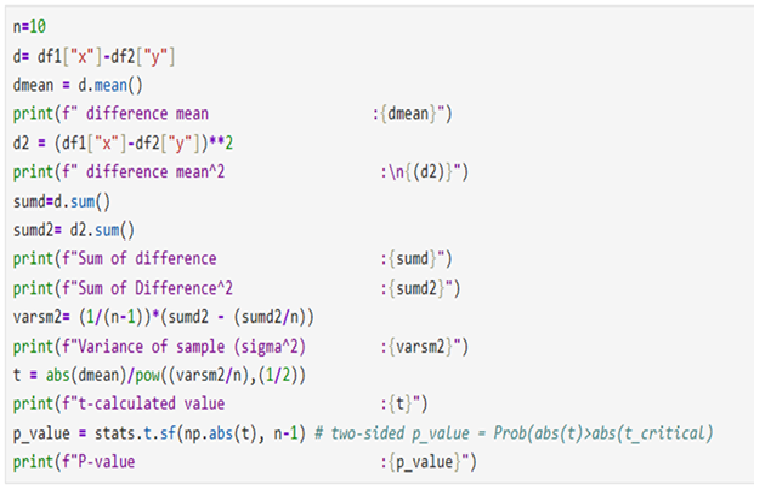
Output
Recommendation:
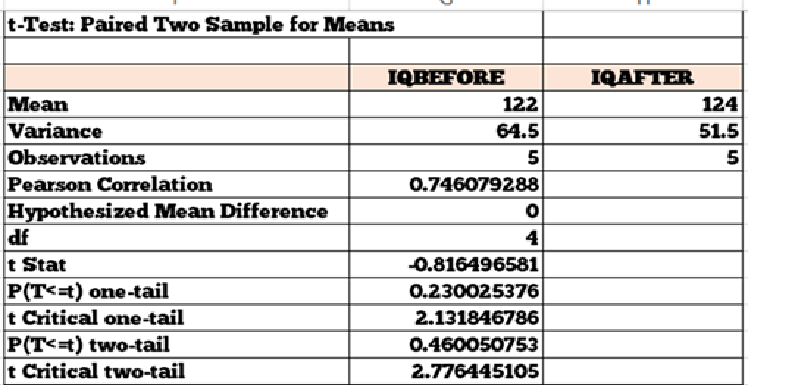
- t-table value at 1% significance level with 4 d.f is 4.6 t-Stat is the calculated value.
- Absolute Value of t-stat is 0.816 which is less than 4.6
- Null hypothesis is accepted.Tests are not significantly different
Exercises
- t-distribution is a continuous probability Distribution- True/False
- The parameter of t-distribution is called ””?
- The value of t-distribution ranges from-1 to +1 True/false
- The variance of t-distribution is greater than 1 True/false
- its means is zero True/False
Answer
1) True
2) ’v’
3) False ranges from-∞ to +∞
4) True
5) True